Miller Deep Value Select Strategy 3Q 2024 Letter
There was no shortfall of unusual global news events during the quarter. President Biden pulled out of his bid for re-election, two assassination attempts on former President Trump occurred, leveraged trades unwound due to significant appreciation of the yen, China undertook record economic stimulus, geopolitical risks in the Middle East escalated, and the Federal Reserve pivoted to a rate easing cycle by cutting interest rates 50 bps. Through the roller coaster of news headlines, the market remained resilient posting its fourth consecutive positive quarter. The record narrow leadership in the equity market over the first half of the year continued early in third quarter. However, as the quarter progressed, we began to see early signs of potential change in leadership. Historically, lower interest rates, a steepening yield curve, the narrowing of valuation spreads and broader market participation have been very favorable for low valuation securities and Small Caps stocks. Will the third quarter mark the turning point and lead to a multi-year cycle with a similar shift?
Let us first revisit where we are with valuation spreads within the equity market. Valuation spreads are not as wide as the extremes after the Covid outbreak; however, they remain very wide versus history. Since 2010, the most expensive decile on a price-to-sales basis has nearly doubled to fifteen times!
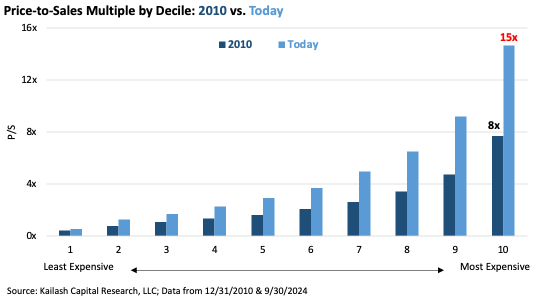
Even the second most expensive decile is now approaching ten times revenue. At quarter end, nearly 20% of the S&P 500 Index weighting has a price-to-sales multiple above ten times and the Russell 1000 Growth Index weighting is now 45%! As we highlighted in previous letters, equities with a price-to-sales over ten times have historically lagged market returns over longer time periods. High valuations embed very high growth expectations well into the future, making their security price susceptible to any unexpected disappointment. In contrast, the least expensive decile remains at a significant discount to the overall market, with much lower embedded market expectations. The lowest valuation decile today has an attractive earnings yield near 15%, more than three times the overall market. There we see attractive investment opportunities with wide price to value gaps! In some cases, there are companies with normalized earnings yields approaching 30%, more than ten times Shiller’s CAPE1 earnings yield and near fifteen times the most expensive decile of the market. The S&P 500 Technology sector and Large Cap Growth Universe remain well above historical valuation levels and have a paltry 3.5% earnings yield (now below the 10-year bond yield). Mr. Market remains very confident in the ongoing successes of longer duration equities today.
As market participants have crowded into longer duration equities, these continue to increase their representation in overall equity market. The top 10% of stocks by size versus the entire U.S. market is closing in on 75%, last seen in early 2000.
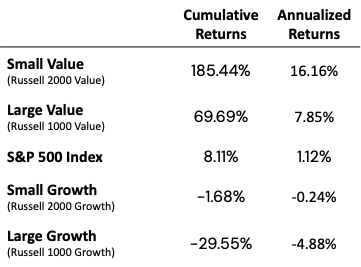
We remember the 1999-2000 time-period. While the absolute valuation levels were higher back then, market concentration is greater today and valuation spreads are close to 2000 levels. Sixty years of history suggests that the current high level of concentration in the equity market will at some point move back towards its long-term historical median. As the chart below highlights, the last time this level was obtained, the market broadened out over the coming years with low valuation securities significantly outperforming the higher valuation growth universe. Not surprising, in 1999-2000, the Technology sector had a greater than 30% weighting in the S&P 500 Index (similar to today) and its subsequent underperformance became a significant headwind to the S&P 500 Index forward returns. Also, we call attention to the significant cumulative returns between small cap value and large cap growth during 2000-2006, 215%, greater than 21% annualized return spread between the two!

The Federal Reserve’s recent policy change may end up being one of the main catalysts for a sustained market cycle. Historically interest rate easing cycles have led to a steeper yield curve with smaller caps outperforming and valuation spreads narrowing over time. On July 11th, after a softer-than-expected inflation report, the market began to discount that the Federal Reserve would soon pivot to an interest rate easing cycle. From July 11th through the end of the third quarter, the Russell 2000 Value Index increased by 10.16% while the Russell 1000 Growth Index decreased by 1.69%. While a short period of time, small cap value outperformed large cap growth by 11.85%, similarities to 2000 to 2006 time-period. Small Cap stocks are also coming out of a multi-quarter earnings recession unlike their large cap universe that is near peak margins and earnings. Any improvement in small cap stocks relative earnings growth over the coming year may be another catalyst to attract market participants and begin to narrow the sizable relative valuation discounts that remain in place.
We see signs of the early stages of a market cycle that favors active investing, concentrated stock picking to outperform the market. While the market may shift back to longer duration assets in the near-term, passive indexes’ current valuation levels are well above historical averages and record concentration in higher valuation securities presents hidden risks for investors. There appears to be a timely opportunity to generate above market returns in high active share strategies that are concentrated in lower valuation securities and have greater exposure to smaller market caps. The resurgence of Active, Value and Small Caps may finally be upon us.
Miller Deep Value Strategy Highlights
During the quarter, the Deep Value Select strategy generated net returns of +4.6%, behind the S&P 1500 Value Index and the S&P 600 Value Index at +9.1% and +11.3%, respectively. While we expect to see short-term volatility, we remain very excited about the long-term return potential of our thirteen holdings and optimistic for the remainder of the year. Year-to-date, Deep Value Select Strategy is up 20.13%, well ahead of the S&P 1500 Value Index and the S&P 600 Value Index at +14.8% and +6.1%, respectively.
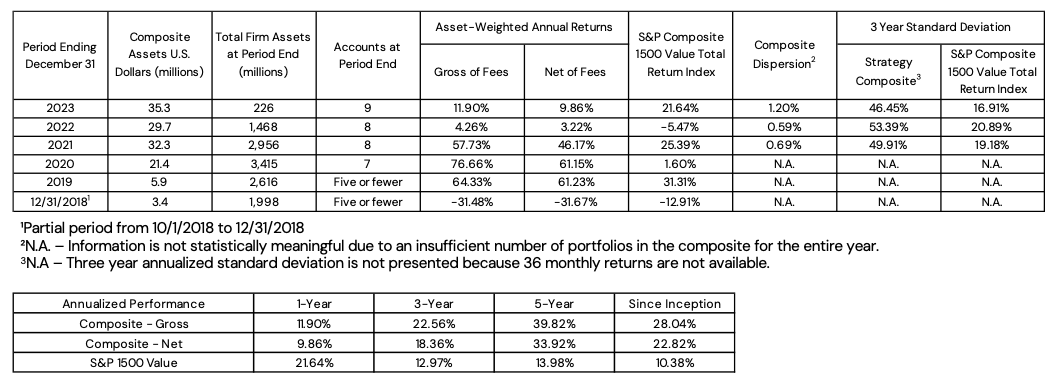
Deep Value Select Strategy Composite Performance (%) as of 9/30/24
| QTD | YTD | 1-Year | 3-Year | 5-Year | Since Inception (10/1/18) | |
| Deep Value Select Strategy (Net of Fees) | 4.60 | 20.13 | 22.14 | 8.06 | 35.51 | 23.42 |
| S&P 1500 Value Index | 9.14 | 14.78 | 30.51 | 12.60 | 13.03 | 11.56 |
Past Performance is no guarantee of future returns. The Miller Deep Value Select strategy incepted 10/1/2018. Performance periods greater than one year are annualized. The “gross” of fees performance figures reflect the day-weighted performance of assets (including cash reserves) managed for the period and do not reflect the deduction of our investment management fees or performance fees but do reflect the deduction of trading commissions and withholding taxes. Throughout this document, the “net” of fees performance figures reflect the deduction of trading commissions; withholding taxes; the reinvestment of dividends, interest and other cash flows; a model performance fee; and a model investment management fee equal to the maximums under our fee schedule for Deep Value Select separate accounts. The following is our fee schedule for new Deep Value Select strategy separate accounts (as reflected above): the model performance fee is 20% of the account’s performance, after the investment management fee has been deducted, above a 6% hurdle rate; the model investment management fee is 1.00% on all assets under management. These model fees have been deducted from the gross returns on a monthly pro-rated basis to arrive at the net of fee performance shown above. Historical separate account investors may have paid lower fees than the model fees used to calculate “net” of fees performance here. The model performance fee is calculated and accrued on a monthly basis and paid out annually. For important performance information, please reference the Deep Value Select GIPS Composite Disclosure.
The Strategy is very concentrated in businesses whose current market prices are currently at a fraction of what we believe their long-term fundamental value to be. With portfolio active share in the high 90s, Deep Value Select is far away from the overcrowded mega-cap concentrated indexes in the marketplace today. At quarter-end, the weighted average market capitalization of our holdings was only $1.4B. While we always expect short-term volatility in returns given our concentration in smaller market cap equities, we believe Deep Value Select has the potential to generate attractive long-term returns for our clients over the long term.
During the quarter, our two largest positive contributors were Gannett (GCI), whose market share price up 20% and United Natural Foods (UNFI), with a market share price up 31%.
Gannett continues to make progress with their long-term transformation to a digital media company. Management expects digital revenues to become more than 50% of company sales over the coming year which would support the company’s return to annual revenue growth. In September, the DOJ presented a very strong case against Google for their Ad Tech business. Gannett’s anti-trust case against Google is very similar to the DOJ case, and we believe it remains overlooked by the marketplace. Gannett is being represented by Kellogg Hansen who won the two largest anti-trust verdicts ($1.2B and $1.3B) and were also successful in defending the appeals of those verdicts. While it is impossible to know with certainty the outcome of Gannet’s legal case, we find it interesting that Kellogg Hansen’s only compensation is tied to Gannett having success in winning their case. This is an important indication of alignment to us. In a scenario where Gannett wins a verdict in the neighborhood of the amount they are seeking, it may mean a windfall greater than all the net debt on the balance sheet. Assuming, as we do, that the current share price has not priced in such a development, the result would be a share price below two times normalized Enterprise Value to EBITDA (EV/EBITDA). Compared with The New York Times, which currently trades at greater than nineteen times EV/EBITDA, a valuation at half of that multiple on normalized EBITDA would support an equity market cap more than $4B for Gannett. While there are risks of temporary setbacks with multi-year transformations, the current market valuation framework appears to remain focused on the company’s historical secular growth challenges. The biggest near-term risk would be unexpected weaker trends in print advertising creating greater near-term secular revenue headwinds. A successful transformation, positive anti-trust case verdict, and potential non-core asset sale could lead to significant upside potential overtime. We believe the shares remain significantly mispriced at only .3 times revenue and greater than 40% normalized free cash flow yield.
United Natural Foods’ share price continues to recover from recent 20-year lows however is still down 60% from its former high. The company’s new CFO recently highlighted a new three-year transformation plan focused on building market share in the natural foods sector, expanding higher margin digital services and rolling out six sigma/lean initiatives to improve operating efficiencies. UNFI is also rolling out a simplified contract structure with their clients which will eliminate layers of complexity positioning the company to achieve greater operating efficiencies overtime. There remains a wide gap between relatively low UNFI margins, and those some smaller distributors are able to achieve. Success on the transformation plan should allow the company to not only narrow that gap overtime but exceed their smaller peers due to their greater size, scale, and higher margin proprietary service offerings. The new transformation initiatives have potential to accelerate profit growth and significantly improve future free cash flow generation. UNFI also has an extensive asset base, and a distribution network across all 50 states and 10 Canadian providences. The company has an extensive distribution and warehouse network, providing a significant margin of safety. As the transformation plan progresses the company says it will focus on optimizing their distribution assets to further improve asset utilization and enhance company financial returns. We believe UNFI long-term upside potential may be multiples of the current share price given our estimation of their long-term earnings power, near 30% discount to book value and Enterprise Value to Revenue of only .1 times! The greatest near-term risk in the company transformation plan would be a delayed recovery in company margins due to the unexpected disruptions from consolidating the Firm’s distribution network.
Our two largest detractors during the quarter were Nabors Industries (NBR) and Quad Graphics (QUAD) that were down 8% and 16% during the quarter. Both companies’ share prices are at deep discounts to their long-term fundamental value in our estimation and we have recently increased our positions in both holdings. Nabors became the strategy’s largest holding during the third quarter.
Energy was the only sector with negative returns in the third quarter. With the recent pullback in commodity prices, there has been ongoing fear that Nabors will experience greater operational pressure on their global rig business. The recent industry consolidation may lead to some near-term choppiness in industry capital expenditures; however, we see this as temporary, as Nabors is well positioned to expand their working global rig count next year. Nabors has signed contracts for a greater than 20% increase in their international working rig fleet over the coming two years. In addition, their joint venture with Saudi Aramco (“SANAD”) plans to expand from 7 to 50 rigs over the coming seven years and has the potential to generate EBITDA in excess of $500M. Leading drilling peers in the Middle East (ADNOC, Arabian Drilling, ADES Holding) have EV/EBITDA multiples between 8.3 times and 11.8 times, while Nabors is valued near 3.5 times EV/EBITDA. We believe SANAD has significant and growing embedded value! Nabors Drilling Solutions segment also has a growing global expansion opportunity. The segment has very low capital intensity and 90% cash conversion. Achieving management’s 20-25% EBITDA contribution target would have a very positive impact on future free cash flow. At quarter end, Nabors’ market share price is only trading at $1.30/share (pre reverse split), which is down 90% from its former highs. With the recent share price weakness, Nabors looks extremely attractive, at less than one times forward cash flow (only lower for a short time during the Covid 2020 outbreak). The greatest near-term risk would be pullback in oil prices under $60/barrel, which could create a global pullback in rig deployments and potentially pressure margins. In this scenario, Nabors share price might be under additional pressure but with a majority of capex dedicated to maintenance capex a falling rig count would also see a pullback in capital expenditures which should continue Nabors to generate free cash flow. We believe Nabors has the potential to generate greater than $1B in free cash flow over the next five years which will significantly reduce company debt and accrue to an equity holder overtime. The marketplace is overlooking the fact that Nabors has successfully reduced debt by $1.8B since the beginning of 2018 and has no debt maturities before 2027. We believe Nabors’ long-term upside potential is multiples of the current share price.
Quad Graphics shares remained under pressure during the third quarter given ongoing revenue challenges from weaker print volumes possibly due to ongoing double-digit postage increases. While weaker print volumes will likely remain a near-term headwind, the marketplace seems to be overlooking the company’s ongoing transformation to a marketing experience company. Leveraging their longstanding relationships with most Fortune 500 customers, Quad has expanded their traditional print offerings to provide customers data intelligence, creative, production media and technology solutions. These marketing solutions services have attractive margins and should continue to grow as a portion of the revenue mix, helping the company to return to annual revenue growth overtime. Quad also owns more than 13M square feet of manufacturing sites and surrounding land which is a significant “hidden” asset. The company has undertaken ongoing manufacturing site rationalization, which maintains higher utilization rates and supports strong margins and cash flow generation. Quad has four properties that are in the process of being sold which should provide additional proceeds to further accelerate debt reduction. We believe the current share discounts minimal success for Quad’s multi-year transformation plan. In our estimation, the company has the potential to generate greater than $175M of free cash flow over the coming six quarters and, assuming non-core asset sale success, which suggests the shares are currently trading at less than three times 2025 EV/EBITDA. This represents a significant discount to the 2023 acquisition of peer RR Donnelley at 6.8 times EV/EBITDA and leading marketing/ad agencies currently trading between seven and nine times. Management is also increasing capital return to shareholders, repurchasing 11% of their shares since 2022 and initiating a 4% dividend yield. Success on their transformation should lead to accelerating growth of free cash flow, earnings, and valuation expansion overtime. We believe Quad’s upside potential is multiples of current price levels. The greatest near-term risk would be an unexpected deep recession which would create greater pressure on the company’s large print volumes. However, the company has in the past been able to offset short-term unexpected revenue pressures by quickly adjusting their variable cost base.
The Deep Value Select Strategy recently passed its sixth anniversary. Since inception, the Strategy has generated annualized net returns of 23.42%. Investments no longer owned have generated more than 75% of our historical performance as we have successfully redeployed capital into new holdings. We’ve opportunistically increased position sizes for holdings when the price-to-value gap has widened over short periods. The portfolio at the end of the third quarter is at valuation levels that are close to the low point over the past six years. We have significant concentration in out-of-favor small and micro-cap securities which remain underfollowed, offering key diversification from the high valuation, crowded areas of the market. Our holdings have sizable revenues and asset bases which are typical of much larger market capitalizations. The underlying asset value provides us the flexibility to be patient to wait for management to improve the underlying business and significantly enhance free cash flow over the next couple of years. We remain excited about the portfolio holdings as most of our investments have multiple value creating drivers that have the potential to generate attractive long-term upside.
It has been a privilege to manage money for our clients over the past six years and we continue to stay disciplined and focused to hopefully continue generating attractive long-term returns going forward.
Dan Lysik, CFA
October 7, 2024