
Deep Value Strategy 4Q 2017 Letter
As we complete the ninth year of economic growth from the “Great Recession,” the marketplace has continued on a recovery path that is different from prior cycles. Below normal economic growth and inflation has been reinforced by historically low interest rates. As you can see from the chart below, the cumulative Real GDP growth since prior peak is still well BELOW the average rebound of 23%.
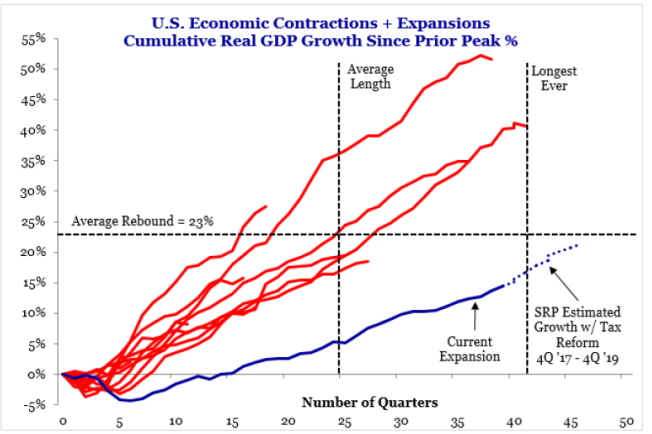
The current expansion of around 15% of cumulative Real GDP since the past peak would be equivalent to the fourth to fifth year of a normal historical recovery.
As we discussed throughout 2017, the environment over the past decade has lead the marketplace to favor Growth versus Value, “bond surrogates,” bonds and low volatility/passive investments. With interest rates and economic growth remaining subdued for most of 2017, Growth outperformed Value last year across all market capitalizations by a margin that was equivalent to historical prior MULTI-YEAR time periods, 2011-2012 and 2014-2015. Similar to early 2016, rolling 10-year performance of Growth outperforming Value is approaching historical extremes. Global interest rates also remained near all-time lows, further fueling $300B+ of inflows into the U.S. bond market last year, pushing the 9 year cumulative inflows to $1.8T! With bond market yields remaining near lows, investors have also favored bond surrogates expanding their valuation multiples to historic relative highs. These investments have also benefited from a growing investor appetite for indexes, ETFs and low volatility investments. As we sit at the end of the year, we are surprised to also see how the total number of indexes have now surpassed the total number of public securities.
While these investment themes have been firmly entrenched into the marketplace for the past couple of years, anticipating change and its potential impact on security prices should be a key focus. With the recent completion of the tax reform and deregulation taking hold, there is a greater likelihood that the landscape could look different sometime during 2018. While it is hard to know the exact impact of the current tax reform, looking back at 2003’s tax reform may provide some answers. Shortly after 2003’s tax reform, CBOE projected accelerating Nominal GDP growth to be greater than 5% for a three-year period. Growth accelerated, however it was even greater as GDP surpassed the CBOE estimates by $1T over the following three years. Post the Great Recession, we also witnessed a significant amount of incremental regulation that increased the cost of doing business for large companies and had an even greater impact on smaller businesses. While hard to estimate, it would not be surprising to find the increased regulatory expenditures could have contributed to a muted capital spending environment during the recovery. With the significant amount of deregulation happening currently in the financial sector, there is the potential for incremental capital deployment over the coming years which should have positive implications for future economic growth.
We have seen current estimates suggest that S&P 500 could see a significant earnings and cash flow benefit (>$10/share) from the recent tax reform. These estimates don’t include any acceleration of economic activity created by new capital spending or consumption acceleration due to significant tax-cut benefits to consumers. While it is difficult to know the exact economic contribution, it is safe to say it will have a positive impact. We have also seen estimates on areas of the market that expect to see the greatest potential benefit, industries with the highest effective tax rate and greatest regulation burden. Cyclical sectors of the market place (e.g., financials, energy, basic materials and parts of consumer discretionary) and smaller companies have a strong representation in this subset. There is the potential for future relative earnings growth to be stronger for these sectors over the next couple of years. It’s also worth noting these sectors currently have a much greater representation in the Value indices.
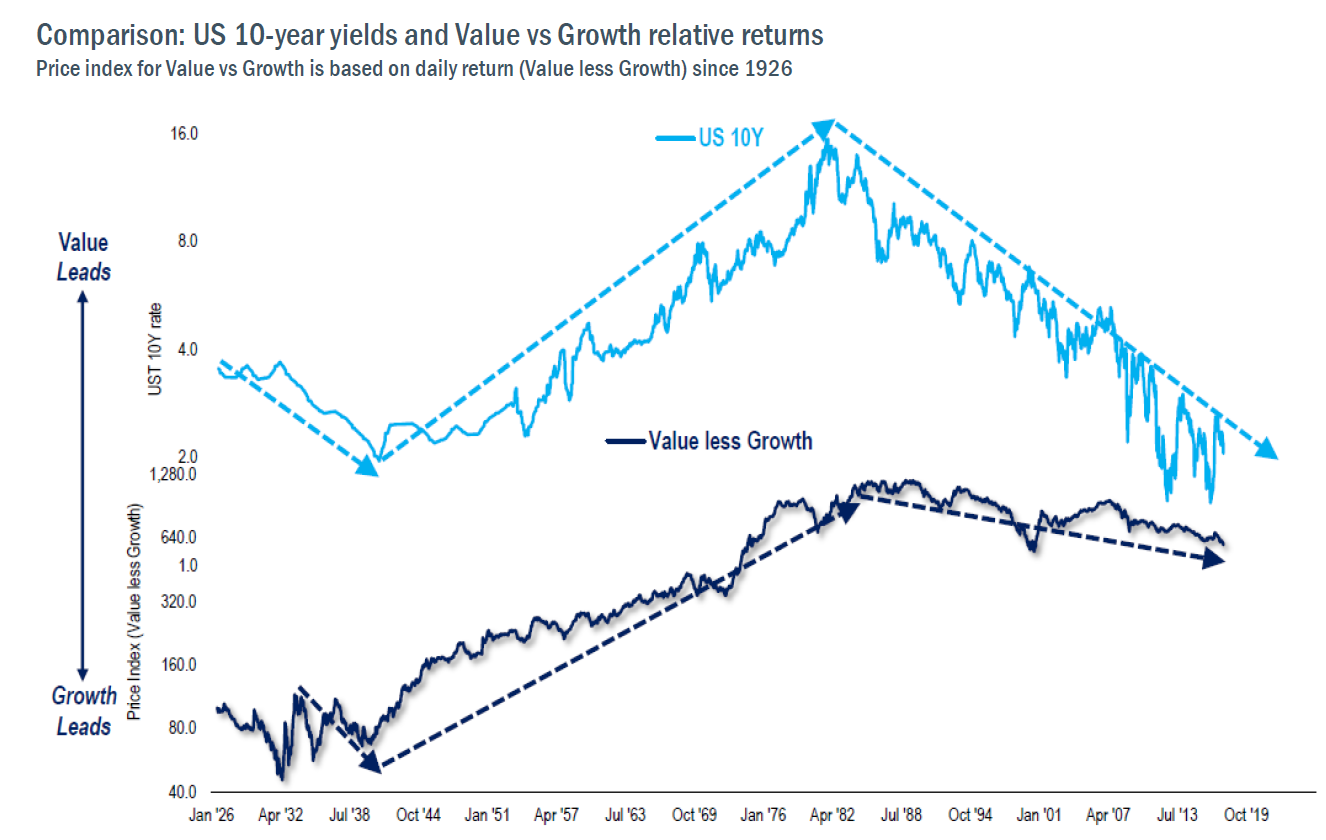
During 2003, stronger economic growth also lead to an increase in interest rates, as the 10-year Treasury increased approximately 100bps to greater than 4%. As economic growth has been below trend over the past nine years, so has inflation. Being at below normal levels of economic growth has had a dampening effect on inflationary pressures. As we start 2018, we are starting to see rising commodity prices, a labor market that continues to tighten and the beginnings of greater economic growth. These are some of the key ingredients that have historically led not only to a positive future rate of change for inflation, but also for the market to begin to recognize greater inflation expectations for the next couple of years. We would not be surprised to see interest rates move higher at some point during 2018 as normalization begins to take hold. As you see from the chart below, a rising interest rate environment has also had a high correlation with Value outperforming Growth which could dramatically change the rolling 10-year performance record over the next couple of years.
Outside an unforeseen event, a potential risk for 2018 could be a slower positive impact from the recent regulation and tax reform. While the estimates of the reforms similar to the past will likely end up being too conservative, we acknowledge that there is risk that it takes some time for the full impact to become apparent. However, as we sit here today, a greater risk that is not being priced into the market could be the quicker unwinding of some of the crowded parts of the marketplace. As economic growth reaccelerates and inflation pressures slowly begin to build, the market appears to be underestimating the negative return potential and liquidity risk of the bond market. There is potential this could also weigh on “bond surrogates” valuation multiples, as well as longer duration assets that have been the greatest beneficiaries of recent valuation expansion.
Back in 2009, we highlighted how the rolling 10-year performance of stocks versus bonds was negative, which, in our opinion, presented a very attractive opportunity for stocks to generate above average returns versus bonds over the following 10 years. While stock returns have been significantly higher since then, the equity market still appears more attractive than the bond market. Using the Fed Model, from current conditions parity would exist with either a doubling of the 10-year yield or a doubling of the market Price-to-Earnings multiple. While neither will likely occur in 2018, the current environment provides a strong likelihood for double-digit earnings growth next year, valuation multiples that remain higher than historical average, and interest rates moving along the normalization path as the year progresses. Similar to equities in early 2009, Value appears well positioned to outperform Growth over the next 10 years. There are still significantly mispriced opportunities in the marketplace at absolute valuation levels that are well below the overall market – levels that have historically lead to very attractive future returns.
Daniel Lysik, CFA manages two strategies: Deep Value Strategy focuses on out of favor securities at very low valuation levels and deep discounts to their intrinsic value, whose current market price does not reflect the companies normalized earnings for free cash flow power, and Concentrated Deep Value Strategy, which is the most deeply mispriced subset of the Deep Value Strategy and typically provides greater exposure to lower market capitalization holdings. Email us for more information and how to invest.