
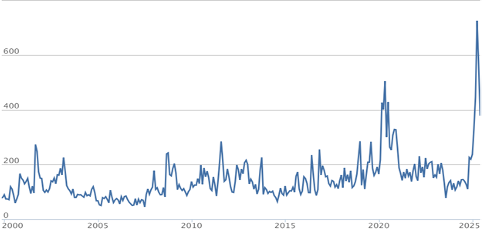
The first half of the year saw increasing similarities to the 2020 time-period. In both time periods, initial tariff and Covid fears drove the VIX Index to over 50 and the U.S. Economic Policy Uncertainty Index rapidly increased to an all-time high. In March 2025, the Economic Uncertainty Index sharply rose to 725, peaking more than 50% higher than 2020’s peak. On April 8th, equity markets troughed and began to recover as the Economic Policy Uncertainty and the VIX Index started their decline.
Over the coming months, the on-again off-again trade policy may cause the market to fluctuate, as it did in reaction to the periodic outbreaks of new Covid-19 variants during the height of the pandemic. However, we believe these pullbacks will more likely be short-lived. In this view, the Economic Policy Uncertainty Index will likely return to historical levels over the next 6 to 12 months.
US POLICY UNCERTAINTY INDEX
While the S&P 500 drawdown reached close to 20% in April, small caps fared worse during the recent fear cycle as rising recession fears caused a nearly 30% drawdown. With small caps still lagging during the recovery, the trailing 10-year return versus large caps is now at a 90-year extreme! We have seen similar extended underperformance cycles in the past – in the early 1950s and the late 1990s. Today market participants appear to be disregarding Fama-French’s historical research work highlighting the size factor benefits to long-term returns.
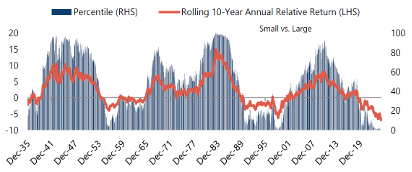
We remember the significant small cap outperformance cycle following the 1999-2000 market peak and how the marketplace overlooked small cap leadership during the first year. We believe investors are served best when taking advantage of low market expectations. Near the 2008-09 “Great Recession” lows, market participants challenged investing in equities, given their underwhelming rolling 10-year relative performance and greater price volatility versus bonds. However, as we all know, if you increased your expose to the equity market in early 2009, you did quite well over the ensuing 16 years.
Today, it appears the market’s expectations are extremely low for the future of small caps. Many market participants will highlight the smaller asset class, lack of institutional ownership, recent underperformance, and number of non-profitable companies (partially due to the multi-year earnings recession). However, we see the growing likelihood that the market will continue to broaden and neglected small caps will soon begin a multi-year outperformance cycle.
Since 1931, small cap stocks have outperformed large caps. However, during this time there have been long cycles (6-15 years) of leadership alternating between small and large caps. The current cycle has been one of the longer ones favoring large caps, now in its 15th year. We also know from historical cycles that market concentration has peaked near the end of a large cap outperformance cycle. The top ten companies’ (by market capitalization) combined weighting in the S&P 500 ended the recent quarter above 38%, more than 600bps above their earnings contribution. While the 38% weighting is much lower than the top ten weighting (60%) in the Russell 1000 Growth Index, it is still well above historical extreme time periods including the Covid peak, Dot Com 2000 bubble and Nifty Fifty.1 At quarter end, the top ten in the S&P 500 had a combined market cap of $20.7T which is approximately 7x larger than the entire Russell 2000 market cap. It would not take much rotation to cause a significant small cap rally. Today, a 1% re-allocation from the top ten to Russell 2000 would increase the Russell 2000 total market cap by +7%!
Recently, we have also seen longer-duration equities become a larger portion of the S&P 500 and reach the historically high valuation metrics of the late 1990s. Kailash Capital recently highlighted the percentage of S&P 500 Market Cap with price-to-sales over 10x is quickly approaching 30% (while the Russell 1000 Growth Index is >55%!)
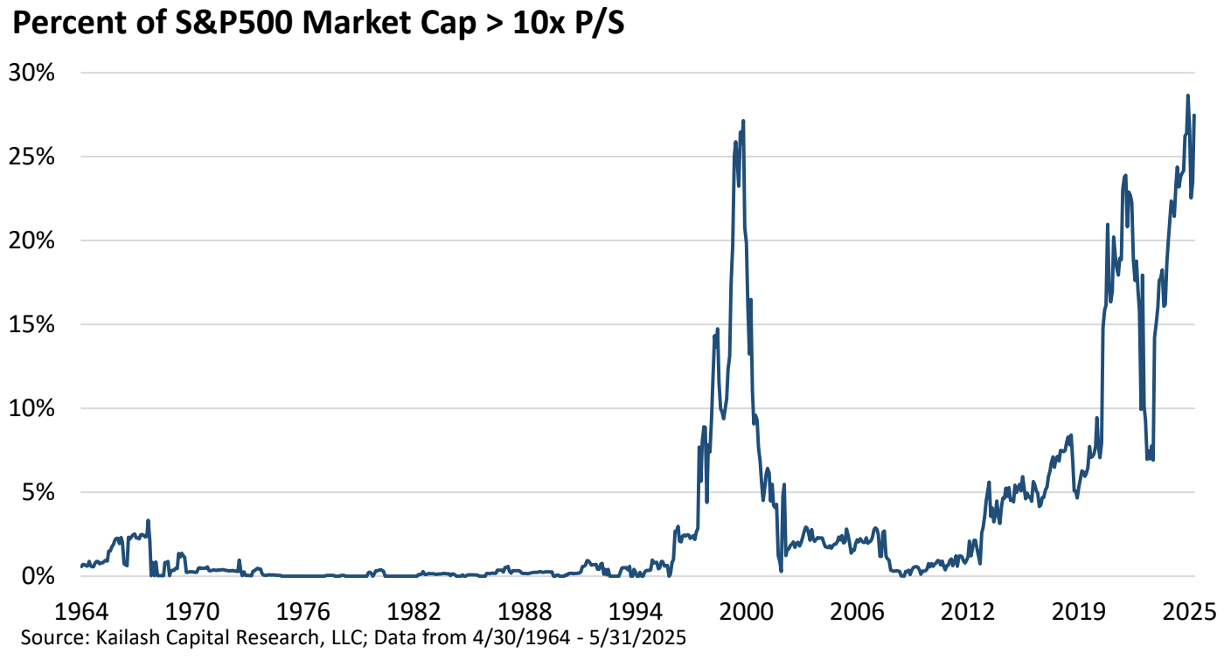
Companies with price-to-sales above 10x have underperformed the market over longer time periods. With a large and growing portion of large cap indexes in longer duration equities, they will likely become a headwind for future large cap returns.
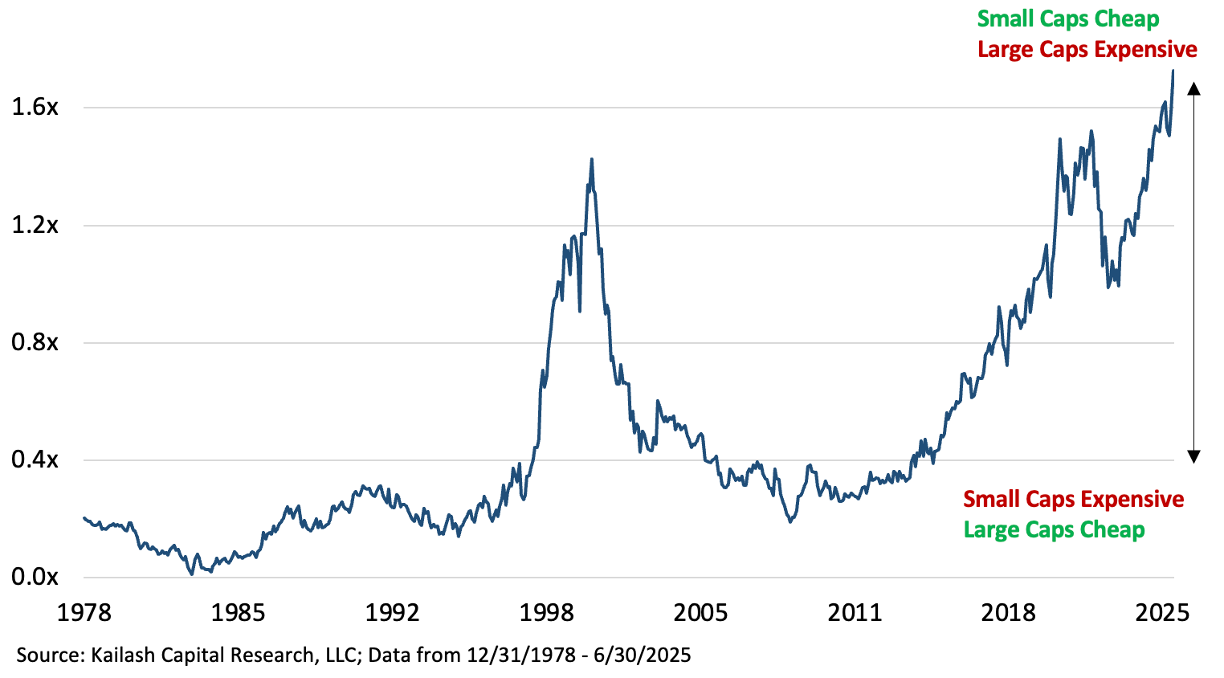
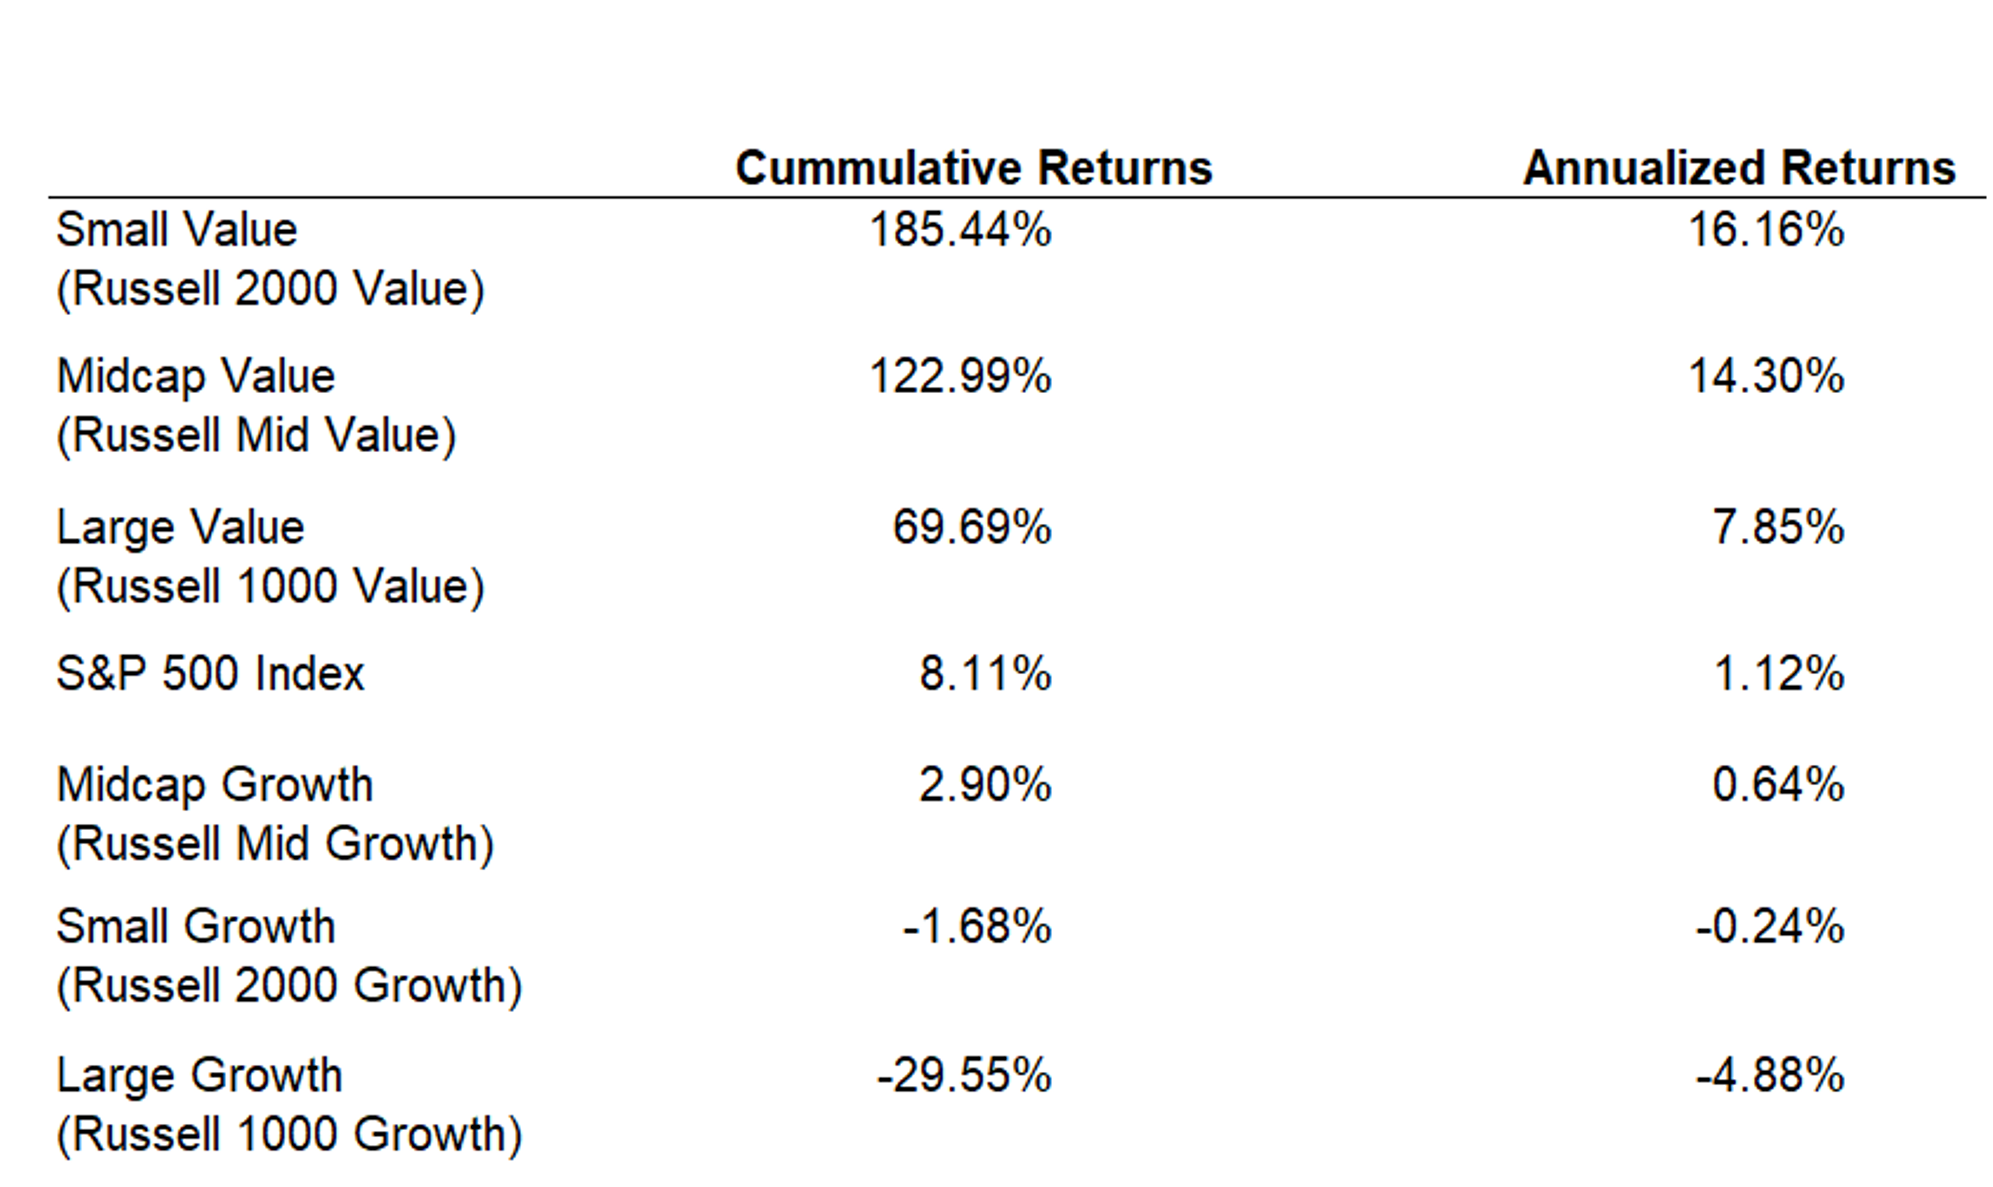
If one compares the prices-to-sales of Russell 1000 versus Russell 2000, it further highlights wide valuation spreads today between large caps and small caps. Today we are well above Covid 2020 and 1999-2000 peak levels of divergence. As the chart highlights, from 2000 through 2006 Small Cap Value outperformed the S&P 500 by 15% annualized and the Russell 1000 Growth Index by more than 20% annualized.
RUSSELL 1000 P/S – RUSSELL 2000 P/S
In April 2020, O’Shaughnessy Asset Management published a study that compared the earnings yield of the most expensive decile of the Russell 1000 Growth Index and the cheapest decile of the Russell 2000 Value. Over the long term, the earnings spread between the two are typically in the 6-9% range. However, in the rare instances that the earnings spread climbs to 18%, it has been followed by small cap value generating greater than 13% annualized relative returns over the following 10 years. Today, the most expensive decile of Russell 1000 Growth has earnings yield below 1% and the relative earnings versus small cap value is near 18%, further suggesting significant potential outperformance by small caps over the coming years.
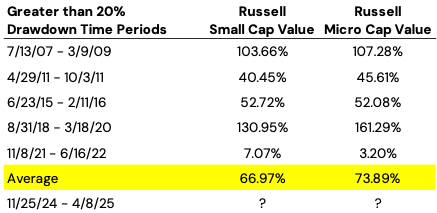
Even though the past 15 years have favored large caps, it is also important to highlight that small caps have generated very strong returns coming out of drawdowns. The chart below looks at 20%+ drawdowns in the small cap market over the past 20 years. Small Cap Value and Microcap Value one year returns from the trough have averaged +67% to +74% returns. Besides the timeliness of coming out of the recent near 30% drawdown in the Russell 2000 Value Index, we also see upcoming tailwinds for small caps.
FORWARD 1-YEAR RETURNS FROM TROUGH
With inflation fears easing, the Federal Reserve may soon restart an interest rate easing cycle. Second, the recently passed tax bill provides ongoing tax relief for smaller companies. Upcoming deregulation could have a favorable impact on some smaller companies’ future revenue generation and profitability. In addition, while Mr. Market is focused on the technology providers/enablers of Artificial Intelligence (“AI”) we believe smaller companies could end up being long-term beneficiaries from greater productivity utilizing automation and AI over time.
As a result of the high levels of uncertainty regarding tariffs there has also been a significant amount of inventory loading and forward buying in certain industries. There is a growing likelihood that large multinational companies’ first half earnings had some one-time benefits. While it is still difficult to quantify today, there could be similarities to the pull forward spending related to Y2K that took place in the second half of 1999. With these possible upcoming benefits to smaller companies and tougher future earnings comparisons for larger companies we see small cap companies’ absolute and relative earnings improving over the next 12 to 24 months.
While it is impossible to predict the exact inflection point, we believe out of favor small caps have the potential for strong double-digit returns over the coming years and remain highly confident that the small cap premium will once again be embraced by the marketplace. Don’t forget about small caps!
Strategy Highlights
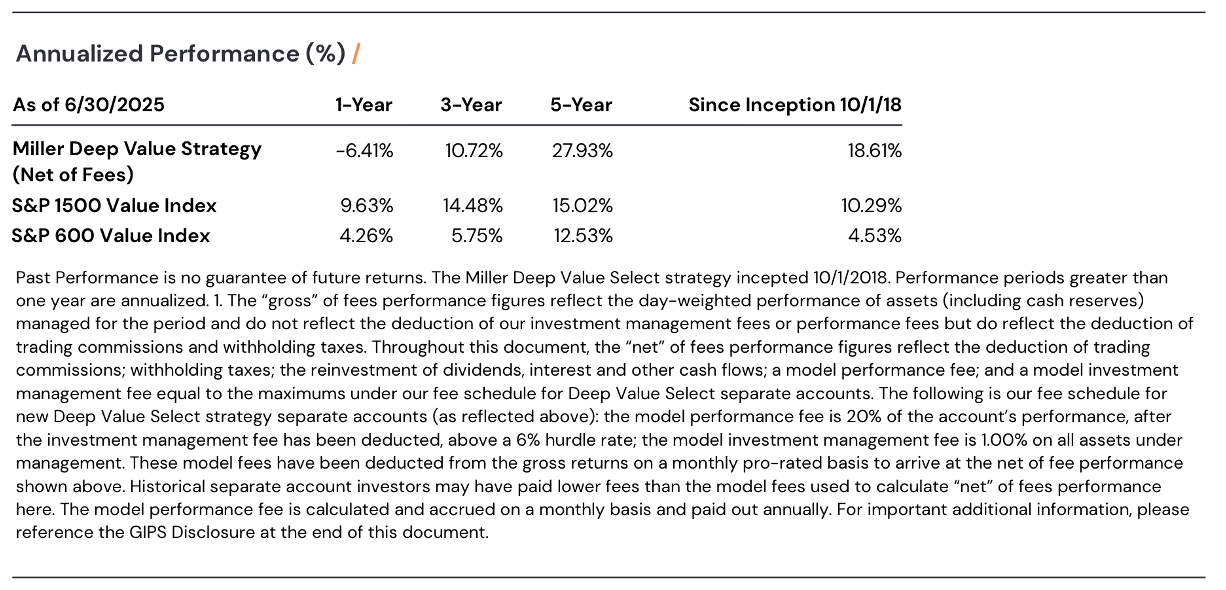
During the quarter, the Deep Value Select strategy was down slightly, -.95%, behind S&P 1500 Value Index +3.02% and the S&P 600 Value Index +2.52%. Year to date, Deep Value Select Strategy net returns are -13.63%, behind the S&P 1500 Value Index at +2.81% and the S&P 600 Value Index at -7.65%.
During the recent quarter, the strategy saw a performance inflection in April which continued through the quarter end. The strategy’s returns in the first half of 2025 are reminiscent of the first half of 2020. It’s worth mentioning that Deep Value Select generated very strong returns during the back half of 2020 into 2021.
We continue to find significantly mispriced turnaround situations in the under-followed and overlooked small cap marketplace. Most of the strategy’s investments have self-help initiatives to improve their profitability. While our holdings are in Small and Microcaps, we believe the companies’ asset bases and business models support a much larger market cap over time. Historical performance has been driven less by the direction of Mr. Market and more by being right about the multiple drivers (margin improvement, achieving normalized earnings and free cash flow, non-core asset monetization, capital allocation and valuation expansion potential) to unlock significant equity value and management’s ability to manage through the business trough. We also look at comparable peers and private market transactions for further support in the revaluation opportunity on a successful turnaround.
During the quarter, our largest contributor was Gannett (GCI) up 24%, recovering a portion of its first quarter drawdown. Gannett remains significantly mispriced in our opinion at only .25x revenue and >50% normalized free cash flow yield. New York Times (NYT), which went through a similar digital transformation ten years ago, has a much higher valuation level, with a price-to-sales of 3x and Enterprise Value to EBITDA (EV/EBITDA) greater than 15x. Our second largest positive contributors was Tutor Perini (TPC), whose shares were up 83%. We initially purchased TPC in the Fall of 2022, near $7/share, a deep discount to tangible book value. The Covid outbreak caused a significant delay in larger civil contracts, weighing on the company’s most profitable segment margins, causing a multi-year earnings trough. Over the past two years, management has successfully rebuilt the company pipeline, enhanced the balance sheet through significant debt reduction and is on track to return the company to normalized profitability. With a portfolio holding return over 400%, TPC is currently trading over two times book value and approaching 10x normalized earnings. We recently exited the position and have recycled capital adding to holdings that have recently underperformed the portfolio and have greater long-term embedded return potential.
Our two largest detractors during the quarter were JELD-WEN (JELD) and Nabors Industries (NBR) and that were down 33% and 32% during the quarter, respectively. Both companies’ share prices are at deep discounts to what we believe is their long-term fundamental value, and we increased position sizes in both holdings during the quarter.
JELD-WEN is a leading North American and European manufacturer and distributor of interior and exterior doors and windows to the new construction and remodeling sectors.
The share price continued to be under pressure due to the ongoing housing weakness impacting company revenues and profitability. At the end of Q1, management took additional cost actions, which should amount to annual savings of $50M, along with $100M of estimated additional productivity savings for the year. These transformation initiatives have not yet caught up with revenue weakness, as company EBITDA margins are currently at historical trough levels. We expect to see EBITDA margins stabilize and improve over the coming 6-12 months.
JELD-WEN’s multi-year transformation plan has a lot of self-help initiatives, having already reduced the fixed cost structure by $350M over the past couple of years. As the company rationalizes the manufacturing and distribution network, there could be opportunities for additional non-core asset monetization overtime. We see similarities to the Masonite transformation plan 10 years ago. Masonite was able to improve EBITDA margins from single digits to 20% before being sold to Owens Corning at 8.6x EV/EBITDA.
Near-term risk is a deeper housing trough that further impacts the remodeling marketplace, causing greater near-term revenue weakness and slower recovery in company margins. The company has ample liquidity, approximately $500M of unused credit facility and greater than $100M+ of cash on balance sheet. We believe that long-term upside potential from JELD-WEN transformation plan supports double-digit normalized margins. With greater than 50% normalized earnings and free cash flow yield, we believe JELD’s share price is significantly mispriced and has upside potential multiples of the current price level.
Nabors Industries (NBR) has undertaken a multi-year transformation focused on leveraging their industry’s leading technology. The company has over 450 patents, and has developed industry leading drilling automation/robotics, Rig Cloud platform and smart apps, rolling out globally, not only on Nabors rigs but also on third-party rigs. The company’s recent Parker Wellbore acquisition more than doubles the Nabors Drilling Solutions (NDS) segment, while further expanding their digital offerings and accelerating the transformation plan. Nabors NDS segment has very low capital intensity with 90% annual free cash flow conversion. As NDS becomes a larger portion of the business over time it should further accelerate future free cash flow generation and debt reduction.
With the recent share price weakness, Nabors looks extremely attractive, at less than one times forward cash flow – the only other period it has traded lower was a short time during the Covid 2020 outbreak. Current marketplace fears are due to falling commodity prices, and expectations for additional rig cancellations later in the year. While oil prices falling towards $50/barrel is a potential risk, we believe this marketplace fear is well known and significantly discounted in Nabors current share price today. Nabors hopes to realize at least $60M in annual merger synergies from the recently completed acquisition, and $200M+ of annual free cash flow generation and accelerated debt reduction.
Nabors’ business segments are all currently trading at a significant valuation discount to their peers. Peer valuation multiples for each of their business segments appears to support an Enterprise Value much greater than the current valuation. In this situation, there are multiple paths to improvement and value creation; we don’t necessarily need all business segments to reach peer valuation multiples given the significant overall discount today. Nabors market cap today is only $540M.
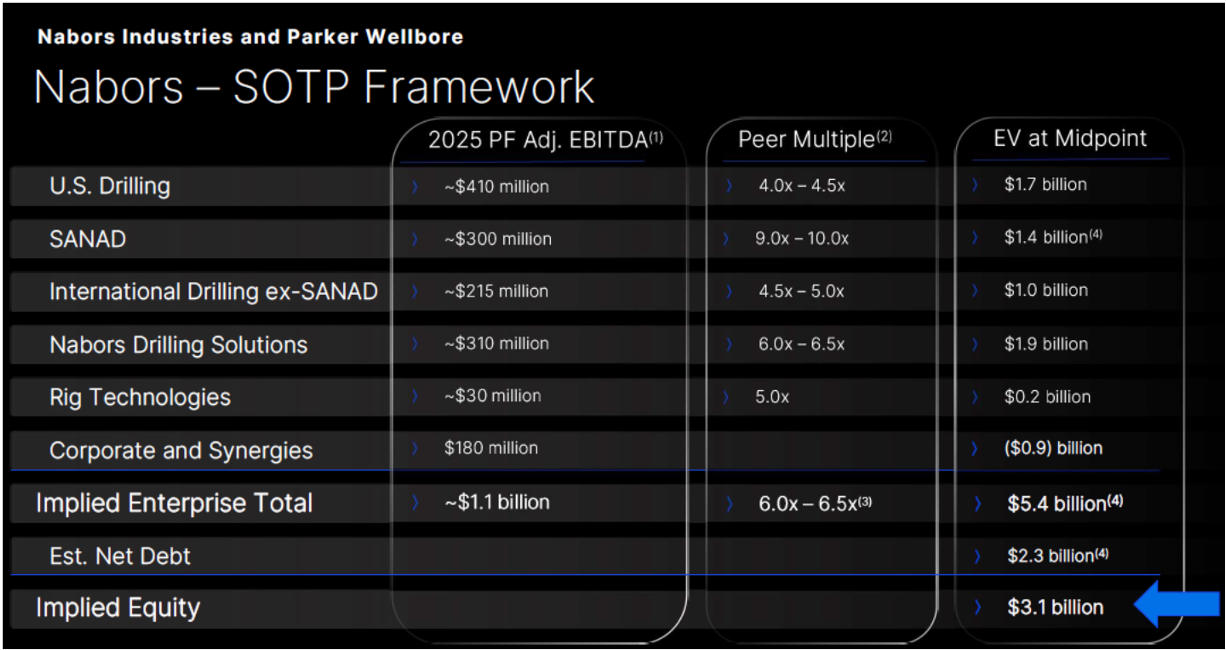
Success on the transformation plan should materially increase Nabors equity market capitalization. We believe Nabors’ long-term normalized EBITDA could be closer to $1.5B, and the company has debt reduction potential of $1B+ over the next five years. Nabors looks significantly mispriced at greater than 50% normalized free cash flow yield.
We remain very excited about the strategy’s current holdings and their significant long-term potential. We have recycled capital from mostly successful historical investments into new investments or holdings that have lagged the strategy historical returns. Since the strategy’s inception, nearly 1/6 of historical holdings have been acquired in corporate mergers or acquisitions at share prices that were on average more than 250% above our initial purchase price. Deep Value Select combined portfolio holdings ended the quarter valued near 1x cash flow and have normalized earnings and free cash flow yields greater than 30%.
We thank our clients for their long-term partnership and remain focused on delivering attractive long-term returns.