
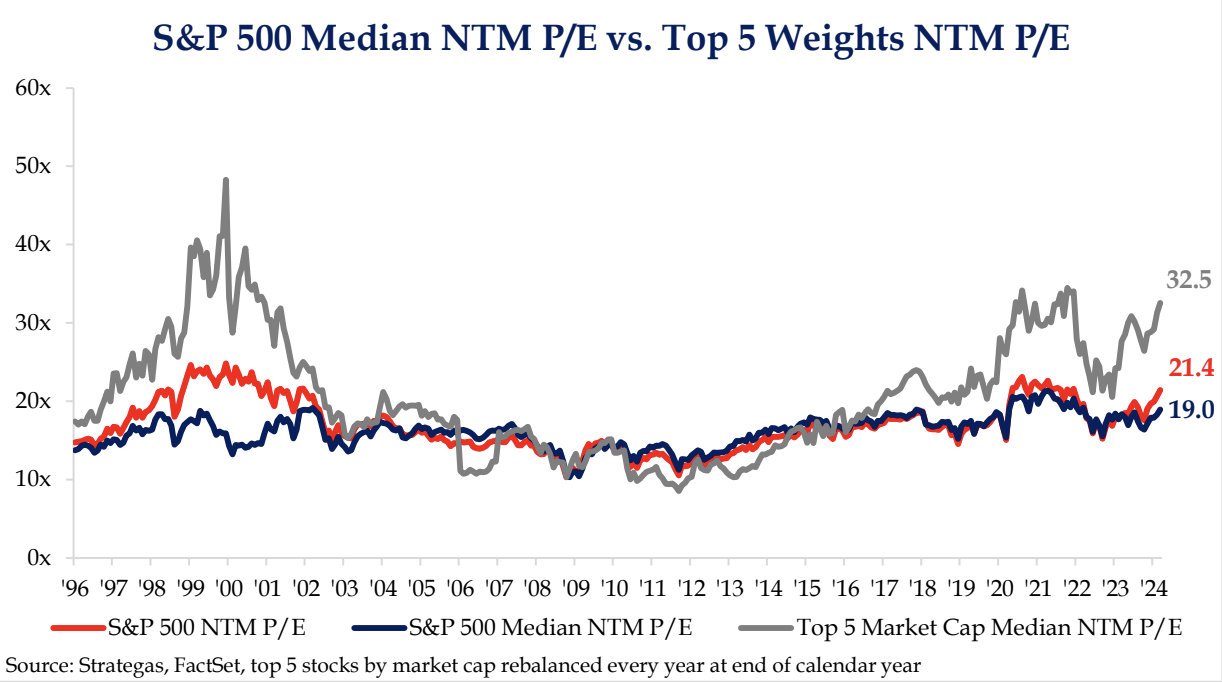
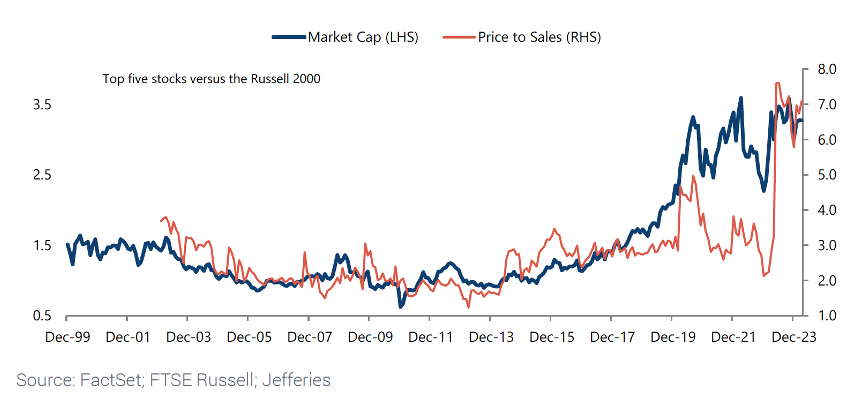
Equity market strength continued in early 2024. Coming off a strong 2023, the S&P 500 gained over 10% in the first quarter. While historically the market has been strong during an election year, the pace of the strength has been higher than the historical average. There were similar themes to market leadership, as mega-caps and longer duration equities outperformed with greater strength in the first 2 months. In our Q4 letter “A Broadening Market Favors Value,” we highlighted how longer duration equities were benefitting from aggressive market expectations for six interest rate cuts during 2024. Equity valuations expanded in the back half of 2023, and continued during Q1. The forward price-to-earnings (P/E) multiple for the five largest S&P 500 holdings increased to 32.5x, a 3% earnings yield, much lower than the current 5%+ “risk-free” money market yield. The higher concentration in longer duration equities in the S&P 500 also lifted the overall market valuation, which is now above a 20x forward P/E multiple. To further highlight the move up in mega-cap valuations over the past couple of years, the top five combined market cap is now 3.3x the size of the entire Russel 2000 Index. That is more than two times the level in 1999-2000 time-period!
Technology stocks remained strong in the first quarter, especially companies that have potential to benefit from artificial intelligence. The Technology sector increased to a 29.6% weighting in the S&P 500 Index. The Technology sector forward P/E multiple also expanded further to 28.4x versus its 20-year average of 17.9x, a 59% premium. Market expectations continue to rise for crowded long duration equities.
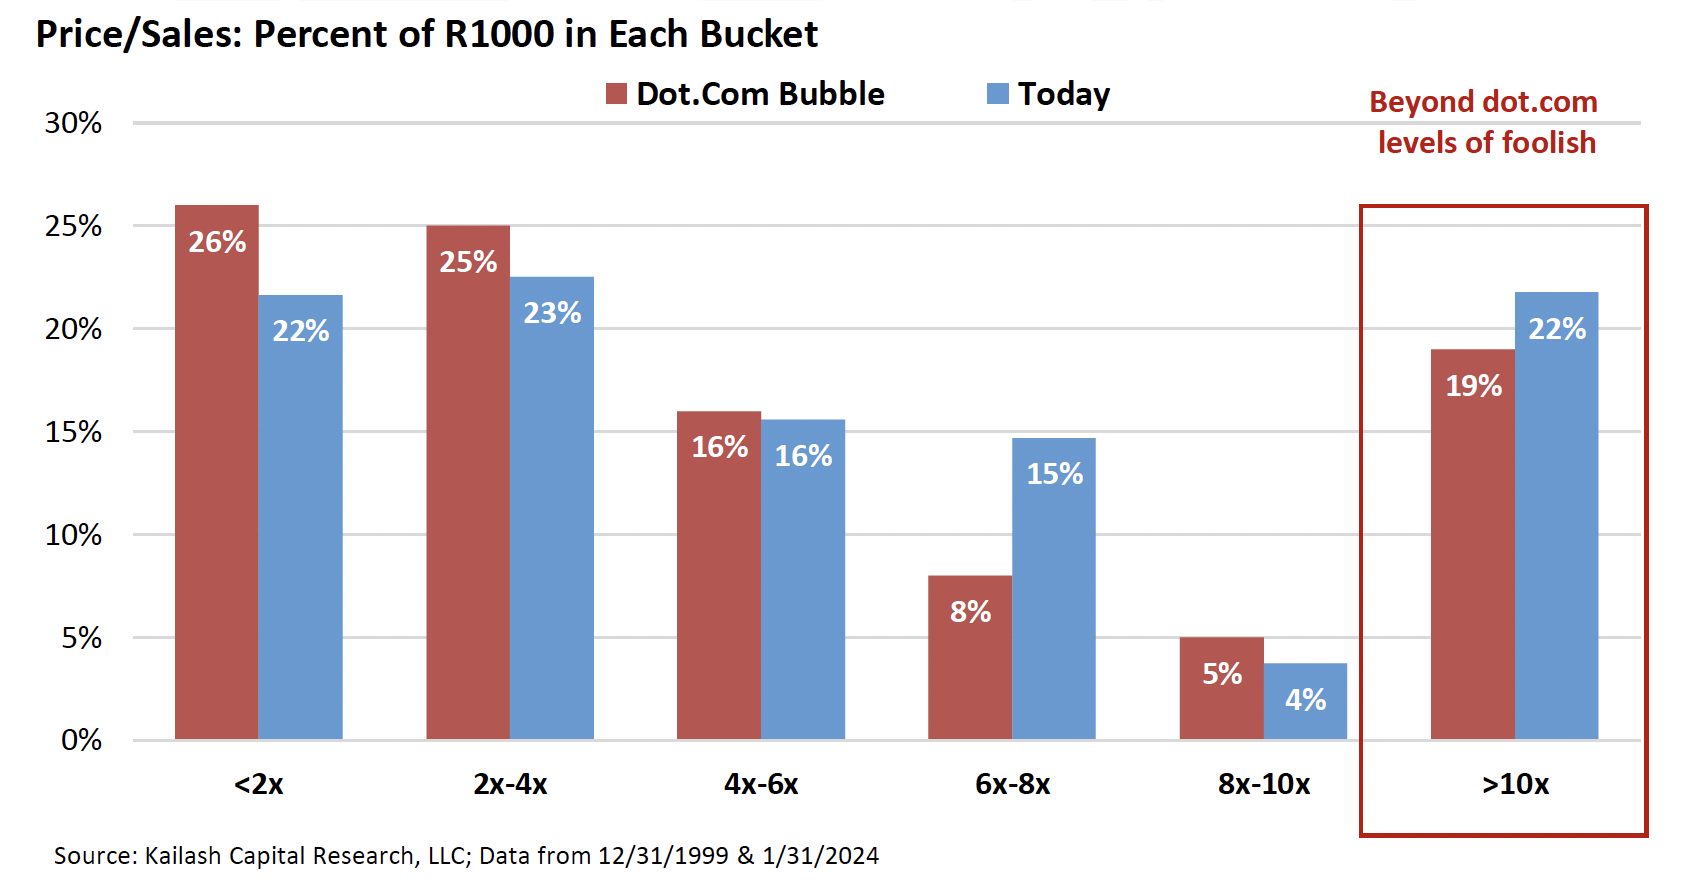
Passive investing has been a beneficiary from the growing market concentration over the past couple of years and the rising presence of the longest duration equities. Their ongoing outperformance is further increasing valuation spreads, as they become a larger portion of passive indexes. As the chart below highlights, 22% of the Russell 1000 index now has a price-to-sales (P/S) multiple greater than 10x, which is higher than the 19% weighting during the Dot.Com Bubble peak! The chart also highlights the considerable influence of market concentration, as a number of the Mega-Caps/Magnificent 7 are valued between 6x and 35x revenue. Companies valued at greater than ten times sales have historically underperformed the market over longer time periods. The longest duration equities remain vulnerable. Will future results meet the current lofty expectations? Will interest rates persist at these high levels? History has shown us that reversion to the mean can be a powerful force in markets. With a low-single-digit earnings yields, the longest duration equities are looking less attractive compared to lower valuation equities with much higher earnings yields today.
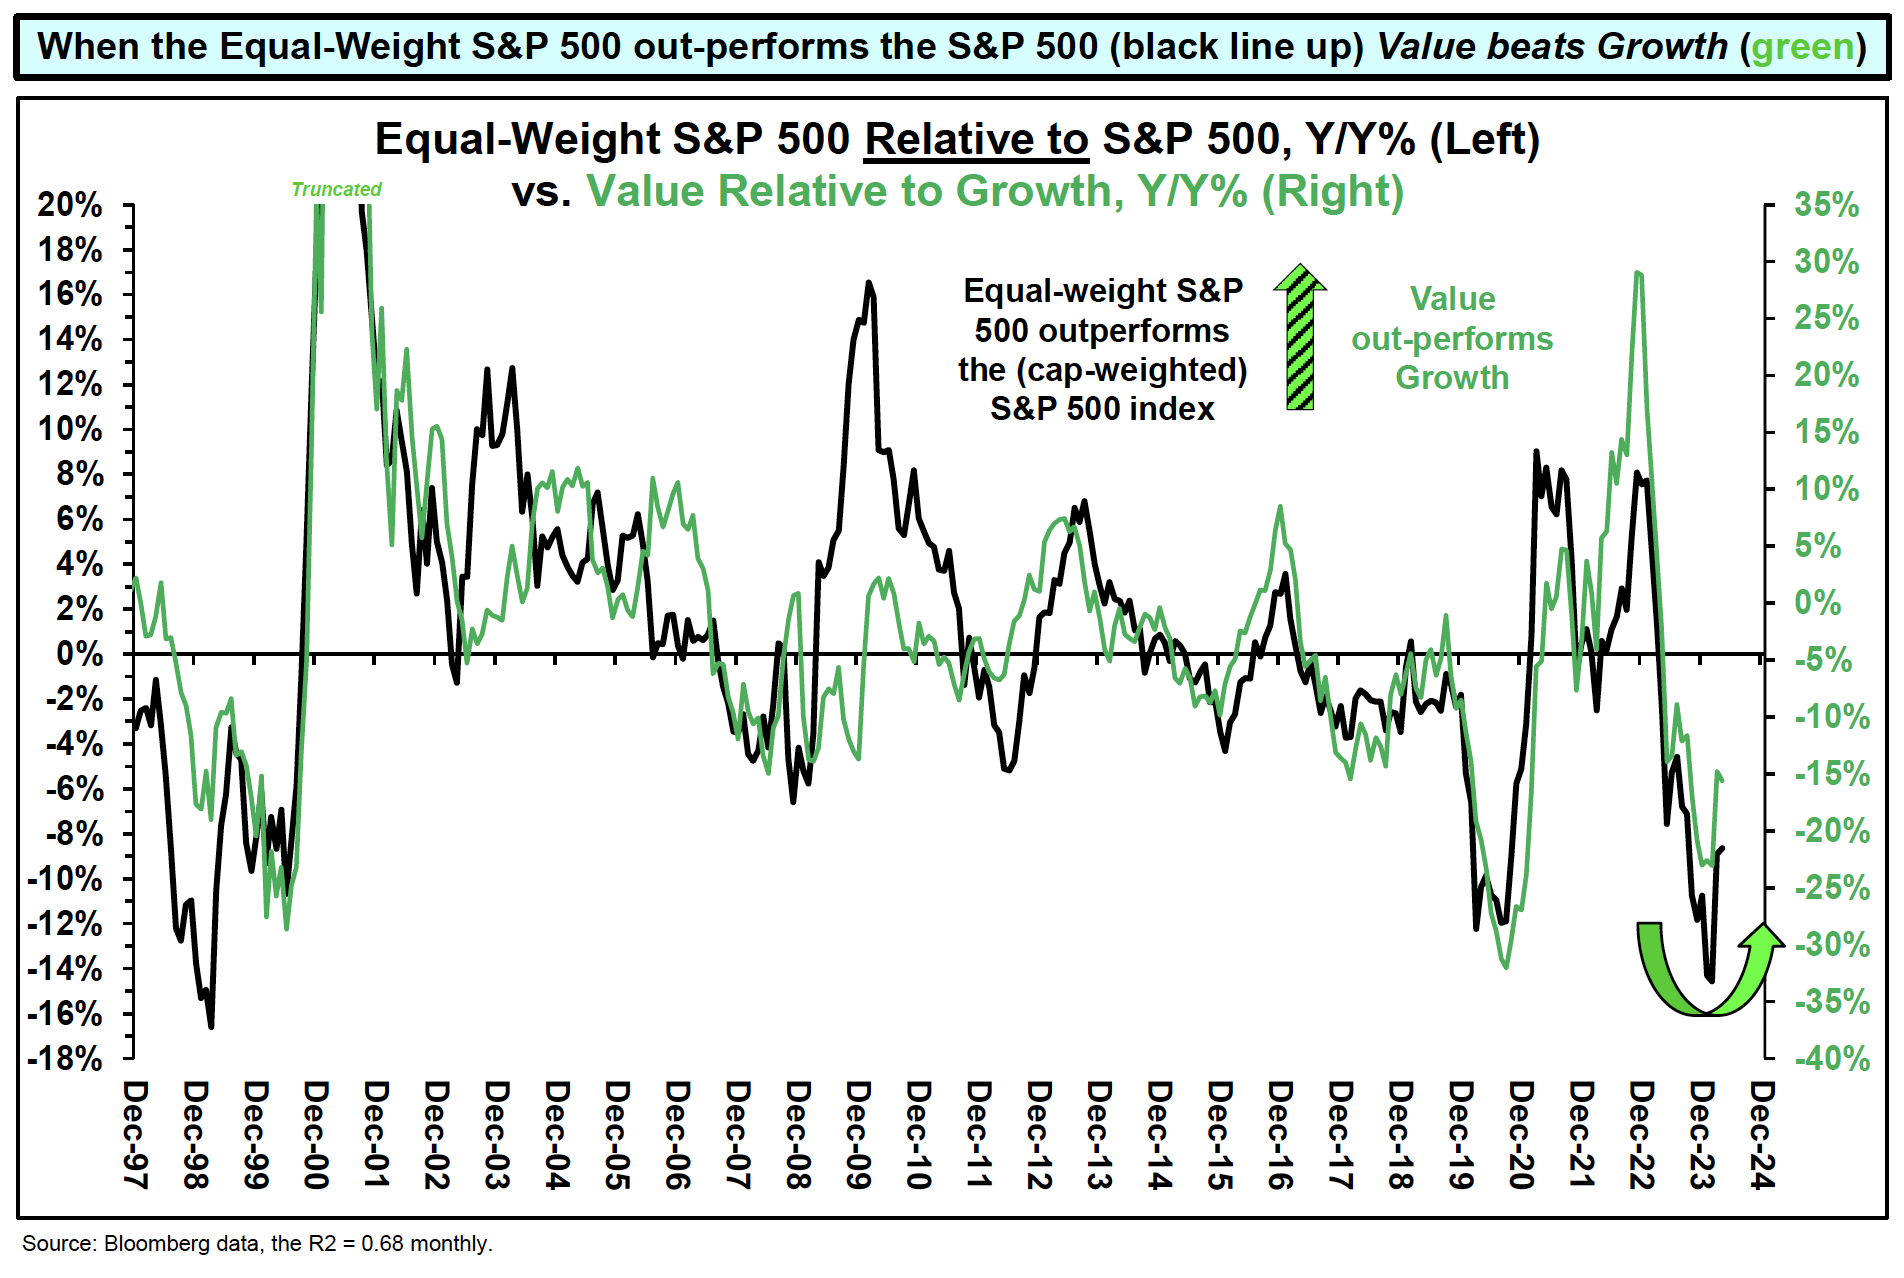
Areas that have underperformed the overall market appear attractive hunting grounds for undervalued potential. As highlighted last quarter, the average stock lagged the market last year, with the Equal-Weight S&P 500 significantly trailing the Market Cap Weighted S&P 500. Early in the first quarter, the underperformance hit historical extremes down more than 14% over the trailing Given the greater representation of lower valuation securities and lower market caps in the Equal-Weighted index, there is a natural correlation between Equal-Weight S&P 500 outperformance versus the S&P 500 and Value outperforming Growth. The significant underperformance of Value and Equal-Weight S&P 500 in the late 1990’s was followed by significant outperformance from 2000 to 2006, and underperformance of 2019-2020 also led to strong outperformance from late 2020 through 2022. However, we are encouraged by the green shoots of broadening growth we saw later in the first quarter this year. As the equity market began to broaden out, Value and Equal-Weight S&P 500 outperformed the overall equity market during the month of March.
The lowest valuation subset remains very attractive today as there are numerous companies at double digit earnings and free cash flow yields, in some cases 20 to 30%+, potentially providing great long-term investment opportunities. As you can see from the chart below the Value indexes are at significant valuation discounts (40-90% discount) to longer duration equity indexes.
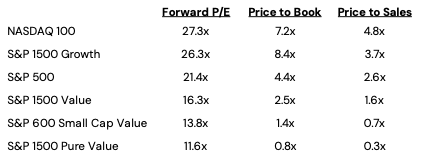
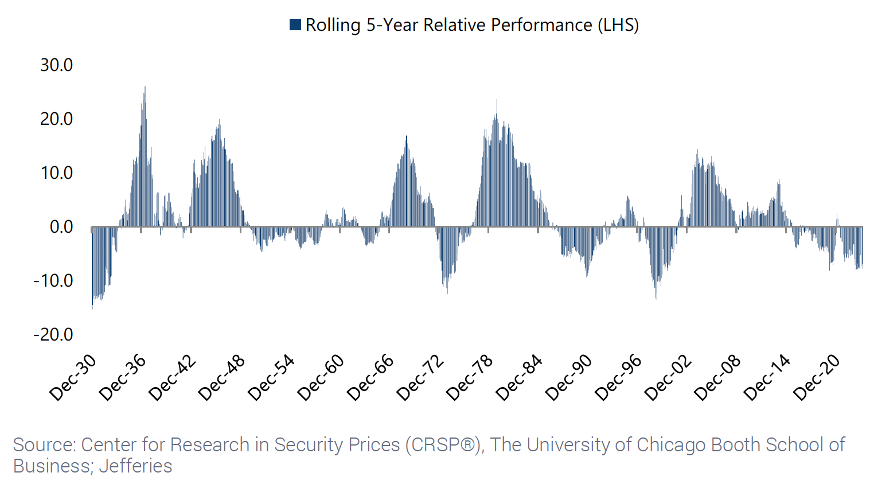
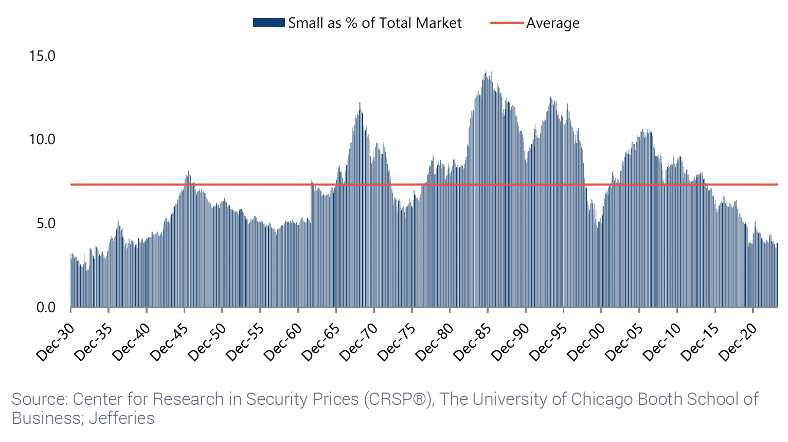
The discount increases as you move down in market cap or look at pure value indexes. Small caps look extremely attractive today having significantly lagged large caps over the past five years. The relative valuation levels between the two are near 45-year lows, an occurrence we also saw in the 1999-2000 time period. It is worth noting that from 2000 to 2006 Small Cap Value had annualized returns of +16% while the S&P 500 was closer to 1% and longer duration equities generated negative annualized returns. While it is always hard to know timing, we see some positive developments on the horizon. Small Caps experienced an earnings recession during 2023 which was a headwind to performance. However, we see Small Caps earnings growth improving as we move into the back half of 2024 and the emerging potential may be greater than the broader market’s continuing into 2025. The combination of reaccelerating earnings growth and valuation expansion have the potential to amplify future returns. In addition, Small Caps are neglected and significantly under owned by investors, compared with historical averages. Small Cap’s percentage of the total equity market is close to 4% (like 2020 lows and well below 1999-2000), which is half of their long-term average. In fact, you would have to go back 90 years to find Small Caps under a 4% weighting. We see an opportunity for significant outperformance over the next couple of years.
Passive investing remains popular and increasingly crowded. We see growing market concentration in longer duration equities as a potential headwind to their future returns. Alternatively, we believe there are very attractive Value opportunities in the marketplace. As the market broadens further, we believe low valuation equities and Small Caps will be a beneficiary. Investors may have an opportunity to diversify into high active-share Value strategies to potentially improve long-term returns.
Strategy Highlights
For the first quarter, the Deep Value Select strategy was up 1.78% (net of fees), behind the S&P 1500 Value Index which was up 7.59% and ahead of the S&P 600 Value Index, which was slightly positive. Lower valuation and smaller cap stocks lagged the overall equity market during the first two months, but then led the marketplace during the month of March. The Deep Value Select strategy had a weaker January and February, and outperformed Value and Small Cap indexes during March.
Deep Value Select Strategy Composite Performance (%) as of 3/31/24
| QTD | YTD | 1-Year | 3-Year | 5-Year | Since Inception (10/1/18) | |
| Deep Value Select Strategy (Net of Fees) | 1.78% | 1.78% | 15.98% | 3.67% | 28.52% | 22.07% |
| S&P 1500 Value Index | 7.59% | 7.59% | 24.70% | 11.61% | 13.00% | 11.36% |
Past Performance is no guarantee of future returns. The Miller Deep Value Select strategy incepted 10/1/2018. Performance periods greater than one year are annualized. The “gross” of fees performance figures reflect the day-weighted performance of assets (including cash reserves) managed for the period and do not reflect the deduction of our investment management fees or performance fees but do reflect the deduction of trading commissions and withholding taxes. Throughout this document, the “net” of fees performance figures reflect the deduction of trading commissions; withholding taxes; the reinvestment of dividends, interest and other cash flows; a model performance fee; and a model investment management fee equal to the maximums under our fee schedule for Deep Value Select separate accounts. The following is our fee schedule for new Deep Value Select strategy separate accounts (as reflected above): the model performance fee is 20% of the account’s performance, after the investment management fee has been deducted, above a 6% hurdle rate; the model investment management fee is 1.00% on all assets under management. These model fees have been deducted from the gross returns on a monthly pro-rated basis to arrive at the net of fee performance shown above. Historical separate account investors may have paid lower fees than the model fees used to calculate “net” of fees performance here. The model performance fee is calculated and accrued on a monthly basis and paid out annually. For important performance information, please reference the Deep Value Select GIPS Composite Disclosure.
During the quarter, our largest positive contributor was Tutor Perini (TPC), whose market share price rose 58%. The company looks well-positioned to benefit over the next couple of years from the $1.2T federal infrastructure law. The Covid outbreak likely caused a delay in larger Civil contracts that weighed on TPC’s recent results. Tutor’s ongoing new business wins seems to have rebuilt the company sales pipeline. In addition, Tutor is diligently working through the legal system to collect past due work, which has the potential to generate >$500M of incremental cash flow over the next 2-3 years if successful. TPC shares remain mispriced in our opinion, trading at a 20% discount to tangible book value. Over the next couple of years, we think Tutor has potential to generate normalized earnings at more than $3/share, as the Civil segment returns to historical average margins. Our two largest detractors during the quarter were Gray Television (GTN) and Fossil Group (FOSL), whose market share prices both fell between 28 and 30% during the quarter. Both company’s shares are significantly mispriced in our opinion, and we have recently increased our holdings.
Gray Television has been under pressure due to the slow start to political advertising this year. However, we believe the marketplace is significantly underestimating the company’s industry leading local TV stations, which are the number one- or number two-rated channels in 90% of their markets. Gray’s local newscasts deliver more household viewership in their 113 markets than the top three cable news networks combined, or the “network prime” (NBC, CBS, ABC and Fox) combined. The company has been outpacing peers in growing their core business over the past couple of years and still appear to be in the early innings of an improvement cycle. Management appears focused on further monetizing their strong audience reach by growing sports content and is aiming to double their high margin digital advertising market share over the next couple of years. In addition, ATSC 3.0 (industry new IP standard), provides opportunity for Gray to stream more content and capture new high margin digital revenue streams overtime. Finally, the recently opened Assembly studio looks like a hidden asset that is being overlooked by the marketplace. We see the potential for Gray’s earnings and free cash flow to improve as political advertising reaccelerates later in the year due to the upcoming elections and their core business shows improving growth. While the company has significant debt leverage, there are limited maturities over the next 2 years. With the potential for $2.5B of free cash flow generation over the next 5 years, Gray should be in a greater position to rapidly de-lever and accrue significant value to the equity holder. With a greater than 60% forward earnings and free cash flow yield, Gray’s long-term upside potential may be multiples of the current share price.
Fossil Group (FOSL) is a micro-cap holding that is undertaking a multi-year transformation. The holding has recently underperformed due to near-term revenue headwinds from exiting their connected watch business, closing non-profitable stores and sales weakness from China. We believe management is taking the right action steps as their connected watch gross margins are well below overall company margins. Exiting the business will also allow the company to remove excess working capital and fixed costs which should have long-term positive benefits to free cash flow. With the recent senior management change, the company will also be undertaking a deeper review of the business which has the potential to remove greater fixed costs and further accelerate their transformation program, targeting $300M (25% of revenue) in total savings by the end 2025. Fossil has an underappreciated balance sheet with greater than $2/share in cash and expectations to be free cash flow positive in 2024 as the company expects to collect a $56M U.S. tax refund and monetizes non-core European assets. There are no debt maturities before late 2026, which should provide ample time for the company to further execute on its transformation plan. Fossil appears significantly mispriced at an 80% discount to its tangible book value. Success on the transformation plan should return the company to revenue growth and has potential to generate >$100M in normalized annual free cash flow. We see significant long-term upside potential, and a far higher share price.
During the quarter, we initiated a position in Lincoln Financial Corp (LNC). Lincoln Financial is a 120-year-old financial services company that provides financial protection and security to its customers through annuities, life insurance, group protection and retirement plan services. Over the past two years, the company has seen significant headwinds in its Life Insurance segment and profit challenges across the business largely due to the Covid outbreak. New senior management has indicated a greater focus on strengthening the balance sheet, focusing on more capital-efficient new business, and improving long-term free cash flow generation. Over the past year, the company has conducted a series of transactions that have improved their balance sheet and enhanced the Firm’s capital ratios. Management is undertaking cost reduction actions and the headwinds in their life segment appear poised to turn to tailwinds over the next couple of years and potentially allow the segment to return to normalized profitability. In addition, the company’s new Head of Workplace Solutions whopreviously at MetLife is focused on improving the company’s Group and Retirement business, accelerating organic growth through new product offerings, and narrowing the segment margins with peers. If the company’s plans are executed well, Lincoln’s operating income could grow double digits over the next couple of years, improving company ROE (return on equity) and free cash flow conversion.
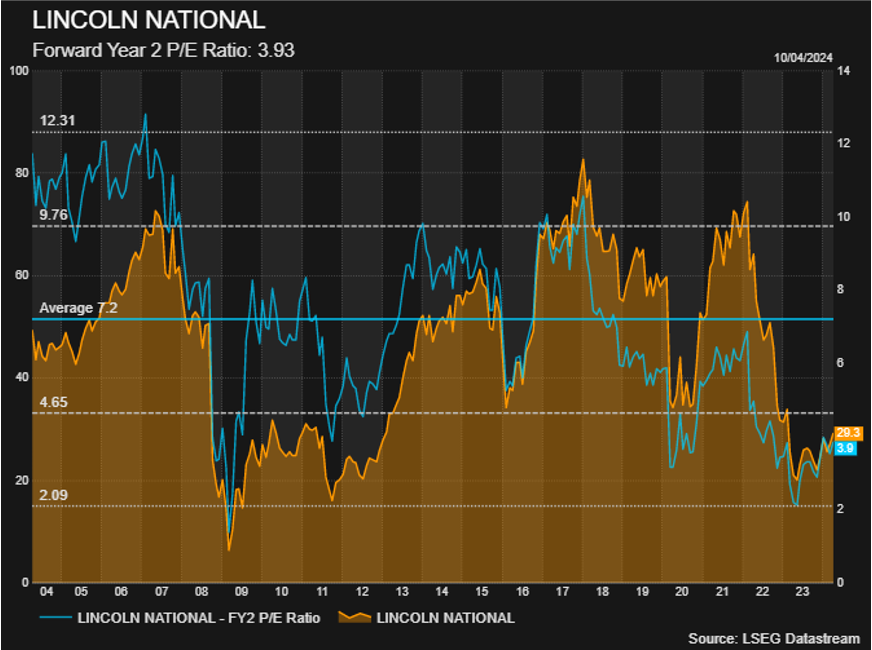
Lincoln is down 60%+ from its 2-year high, at an attractive 50% discount to book value and 30%+ normalized earnings yield. Achieving long-term free cash flow conversion targets would support annual free cash flow in excess of $1B. With a forward price-to-earnings (P/E) multiple close to four times, every one multiple point improvement generates approximately 25% in share price returns (significantly higher than the S&P 500 today which would be closer to 5% for each multiple point improvement and for the top five market caps, closer to 3%). Over the next 3-5 years, LNC returning to normalized earnings and valuation expanding back towards the peer group 20-year P/E average of 9.6x and 1.2x book value, would support upside potential near three times its current price levels.
While the marketplace continues to crowd into mega-cap and longer duration equities, we believe Miller Deep Value Select Strategy provides investors with a timely strategy to take advantage of sizable market dislocation with attractive long-term return potential. We maintain very concentrated investments in what we believe are significantly mispriced and underfollowed smaller cap companies. Our investment holdings have sizable asset bases (which provides a margin of safety) and businesses with significant operational improvement potential. We believe as earnings normalize and free cash flow materially increases over the coming years, attractive valuation expansion will be supported. The strategy has also historically benefitted from holdings being acquired; while it is impossible to know if this will continue in the future, we are encouraged to see private equity recently becoming top ten holders in a couple of our largest holdings.
We thank our clients for their trust and believe future performance will benefit from the large price-to-value gap in our current holdings.