
Miller Deep Value Select 3Q 2023 Letter
The marketplace remains focused on trying to determine whether the economy will see a soft landing or an eventual recession over the coming months. It is nearly impossible to forecast these future outcomes with certainty because Fed policy has lag effects on the economy. It’s also the case that financial markets tend to lead the economy (discounting the future). We believe it is more beneficial to focus on where market expectations appear elevated, thereby creating potential future risk, and where expectations remain overly pessimistic, creating potential investment opportunities for favorable long-term returns.
While longer duration equities have regained popularity this year, their valuation multiples remain well above the overall market and not far from historical highs. Market expectations for these securities appear elevated to us as marketplace participants discount strong growth well into the future with minimal impact from higher interest rates. For the past couple of years, we have highlighted how the growing level of concentration in the equity market has been driven by longer duration equities and Mega-Caps. During the 3rd quarter, the S&P Growth and S&P 100 Mega-Cap Indexes outperformed by a narrower margin than earlier in the year, falling less than the overall market. However, the 10 largest companies by market cap surpassed 2021 highs, moving up to a 33% weight in the S&P 500 Index; a concentration last seen in the early 1970s!
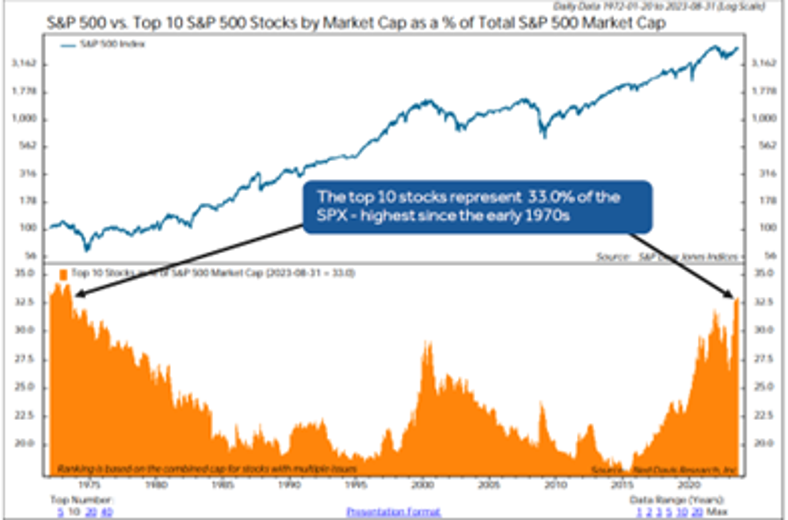
The main driver has been the success of the largest 7 or “the magnificent 7” whose combined average return for the first 9 months of 2023 was +87%! The largest 7 stocks have seen valuation expansion this year, as their average price-to-earnings multiple peaked at 34x in August (10 multiple points higher than their long-term average). Meanwhile, the remaining 493 stocks in the S&P 500 Index had an average return of 2.6% and their forward price-to-earnings multiple tracked closer to their long-term average.
The significant outperformance of larger market cap securities can also be seen upon a closer look at the Russell 1000 Index. The chart below by Kailash Concepts Research highlights the trailing 10-year return spread between the Russell 1000 Value-Weighted Index and the Russell 1000 Equal-Weighted Index. Over the past 10 years, the Equal-Weighted Index has trailed by 60%, with the spread now approaching its early 2020 lows.
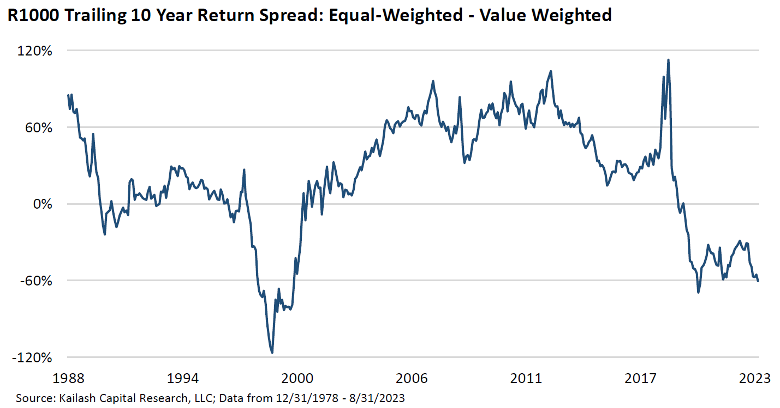
These levels were only lower in the late 1990s! As we highlighted in our 2nd quarter letter, The Market is a Weighing Machine in the Long Term, wide valuation spreads have been a historical catalyst to the eventual narrowing of performance dispersions. The chart below highlights the historical price-to-sales premium of Russell 1000 Value-Weighted to the Equal-Weighted. The premium remains in the top decile of observations going back to 1978. It is not surprising to see a 20% premium but rare for it to be in excess of 60%.
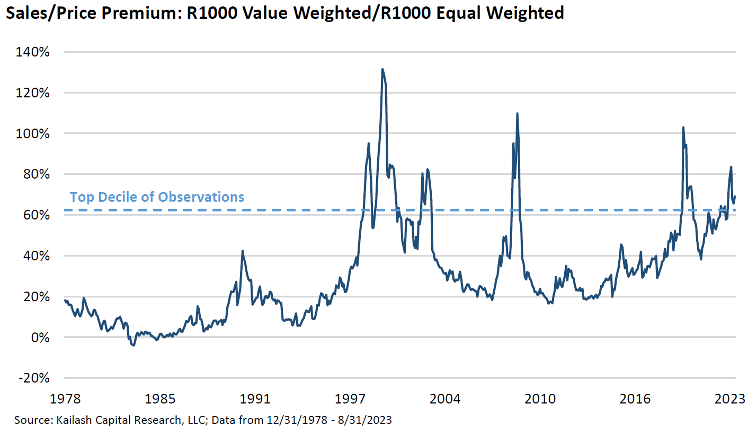
In addition, it is important to highlight how the reversion can be rather swift once extreme levels are reached. Looking at historical time periods when the valuation spreads were in the top decile, the Equal-Weighted securities consistently outperformed over the following one-, two- and three-year time period, with the longer time periods seeing outperformance in excess of 20%. Returning to historical valuation spreads suggests the potential for attractive future relative returns for the broader marketplace and low valuation securities.
Moving down in market cap further highlights the significant long-term opportunity in smaller cap equities today. The charts below compare the Russell 2000 Index to the Russell 1000 Index. Market expectations remain extremely low for small cap securities, as they have underperformed for the past 10 years. At the end of the 3rd quarter, the average small cap stock is down more than 30% from its 52-week high and the recent underperformance versus larger cap stocks is now below 2020 lows, approaching the 45-year extremes in the late 1990s.
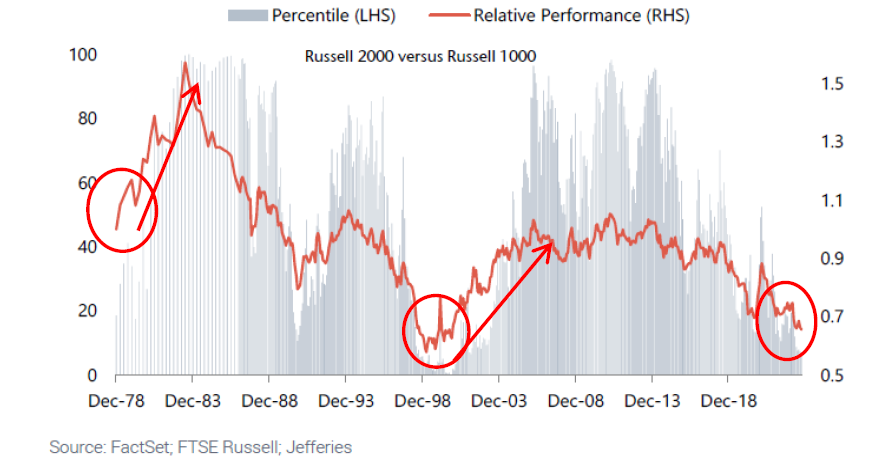
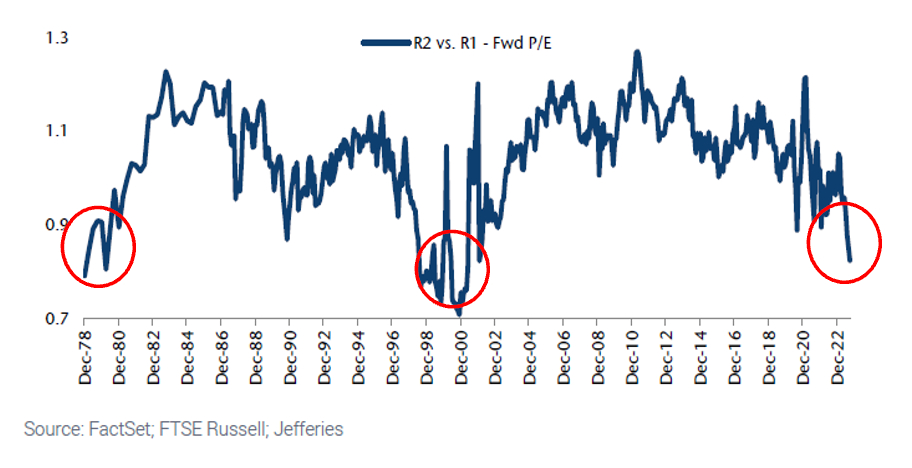
As you can see from the red circles on both charts, when the historical underperformance of small caps has coincided with significant valuation discount to larger market caps, it has historically led to strong future outperformance for smaller cap equities. From 2000 to 2006, the Russell 2000 Value Index generated annualized returns of +16.2% versus the S&P 500 Index +1.1% and Russell 1000 Growth Index -4.9%.
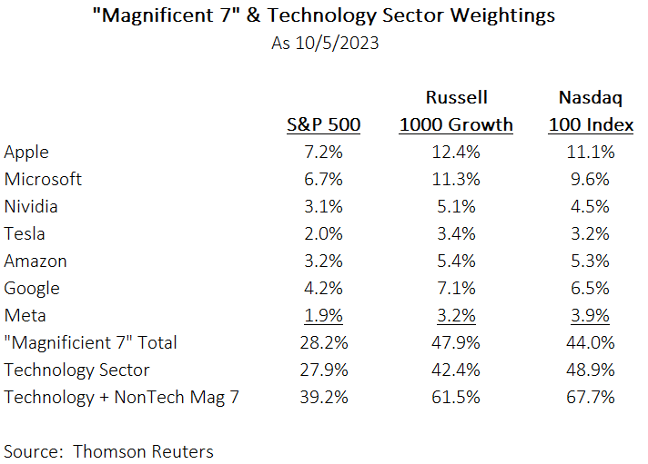
Over the past couple of years, major Indexes have become more concentrated in Mega-Caps and expensive longer duration equities (Technology sector). The popularity of passive investing has further increased marketplace crowding. Market participants who are invested in S&P 500 Index, Growth Indexes and Nasdaq-100 may not realize how concentrated they are today in longer duration equities.
While small caps have been in an extended bear market, we believe valuations are extremely attractive and market expectations are too low creating a compelling opportunity with valuation metrics not seen in approximately 20 years. History would suggest that there is a multi-year outperformance cycle for small caps in the near future that should reward patient, long-term investors.
Strategy Highlights
For the third quarter, the Deep Value Select strategy return net of fees was +15.50%, ahead of the S&P 1500 Value Index -4.20%. Year-to-date through September 30, 2023, the strategy return is +8.56% (net of fees), now ahead of the S&P 1500 Value Index return of +6.98%. As we highlighted last quarter, the 3-month time period from March to May was one of the worst 3-month time periods since the strategy’s inception. Following 20%+ drawdowns, we have historically seen the strategy more than recover over the following 6 to 12 months.
Most of the Deep Value Select strategy investments participated in the stronger quarter, with 75% of our holdings up greater than 9% and 40% of the portfolio advancing more than 20%. During the quarter, our largest positive contributor was Nabors Industries, with a share price that was up in excess of 30%. In our opinion, Nabors shares remain significantly mispriced at an Enterprise Value to EBITDA (2024) of 3.5x and a greater than 40% normalized FCF yield. With the improvement in oil and gas prices this year, we believe domestic drilling activity will show improvement over the coming year. Marketplace long-term expectations appear well below management forecasts for the company’s international segment, proprietary drilling solutions business, and new energy transition businesses providing a nice ongoing variant. These segments should become a larger portion of company profitability and free cash flow over the next 3-5 years. Nabors appears well positioned to deliver $1B of incremental free cash flow over the next couple of years, which has the potential to unlock significant equity value over time.
Chico’s FAS, Inc. (CHS) was also a strong contributor, with a share price up close to 40%. Late in the quarter, Chicos announced that Sycamore would be acquiring the company for $7.60/share, a 65% premium to the previous day’s close. Three years ago, in our Q3 2020 letter, Value: A Timely Opportunity we highlighted our initial investment in Chicos. At that time, Chicos was trading close to $1/share, under significant pressure due to the Covid outbreak. New CEO, Molly Langenstein has been successfully executing the new transformation plan, closing unprofitable stores, streamlining their operations, expanding digital and omnichannel efforts and significantly enhancing their branded merchandise. With the take-out price more than 6x above our initial cost, Chicos has been one of our strategy’s top positive contributors over the past 3 years.
The two largest detractors were American Axle (AXL) and Gray Television (GTN), with share prices down 12% and 11% during the quarter. Both company’s shares appear significantly mispriced, providing long-term upside potential multiples of their current share price.
American Axle (AXL) is being adversely impacted by the UAW’s recently announced strike against the “Big Three” domestic car manufacturers. While the strike will create near-term headwinds for the auto industry, we continue to believe that the long-term supply/demand fundamentals remain favorable. A longer strike may further reduce dealer inventory below historical average levels and lead to an even greater industry shipment recovery cycle. The marketplace also appears to be underappreciating American Axle’s new product innovation as the company is expecting at least $2 to $3B in incremental sales related to electric vehicles over the next 5 to 7 years. American Axle remains very attractive at a >40% normalized free cash flow yield.
Gray Television (GTN) has also been under pressure with ongoing recessionary fears. The company has a strong market position, with the #1 ranked local TV station in 70% of its markets. We see the potential for earnings and free cash flow to dramatically improve as political advertising reaccelerates due to the upcoming election year. In addition, there are low expectations in Gray’s stock price for their Assembly asset, as no analysts are currently including any future economics. With the writers strike behind the industry, Assembly studios will begin to scale up production. While the company has significant debt leverage from prior acquisitions, there are limited maturities over the next couple of years. We see strong free cash flow generation over the next 5 years (potentially >$2.5B) that could allow the company to rapidly de-lever. With a greater than 60% forward earnings and free cash flow yield, Gray’s long-term upside potential is multiples of the current share price.
Recently we initiated a position in Bread Financial (BFH), formerly Alliance Data Systems. The company share price is down near historical recessionary price lows. Bread Financial provides proprietary direct-to-consumer credit cards and deposits along with digitally enabled private-label, co-branded credit cards, installment loans and buy now, pay later (BNPL). New management joined the company in 2020 and has completed a multi-year transformation to streamline its business model, develop differentiated products and expand brand partnerships. A new CFO has also dramatically improved the company’s balance sheet, enhancing their capital ratios nearly 3x to 9%+, reducing debt by $1.7B and increasing direct to consumer deposits by nearly $5B. Since 2020, BFH’s tangible book value has grown by >30% and is approaching $40/share. While the marketplace is concerned with potential industry changes to late fee payments and weaker consumer spending, management believes they will be profitable even if a deeper (2008-09-style) recession occurs.
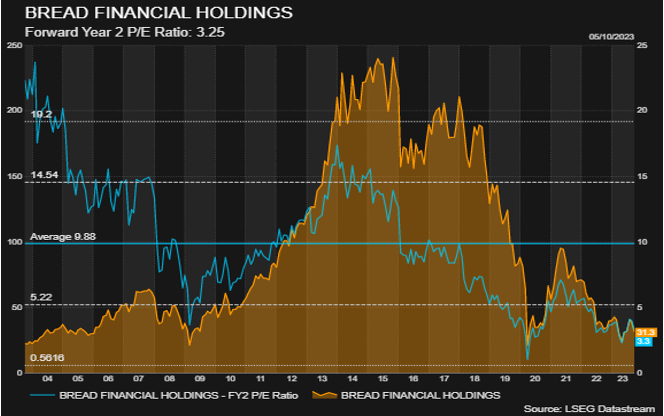
We believe current marketplace concerns are significantly discounted in BFH’s low valuation, price to earnings (FY2) of 3.3x, and 25% discount to current tangible book value. Management’s long-term return-on-equity target is also significantly higher than market expectations providing a nice variant. We believe BFH upside potential over the next 3-5 years is more than three times the current share price.
Fossil Group (FOSL) appears to be a significantly mispriced global luxury good company with extremely low market expectations. The company designs, develops, markets, and distributes fashion watches, jewelry and accessories for their owned brands (Fossil, Michele, Skagen, Watch Station and Zodiac) and licensed brands (Armani Exchange, Emporio Armani, Diesel, Kate Spade NY, DKNY, Michael Kors and Tony Burch). The company recently announced a significant transformation plan that management expects to generate $300M of operating income benefits by 2025, more than 20% of annual revenue! The plan will focus on improving sales productivity (digital first approach, redesigning pricing/promotions and closing non-profitable stores), reengineering operations, streamlining overhead, and improving capital efficiency. With ongoing headwinds to company sales in the near term the current share price is discounting limited future benefits from the transformation plan. Fossil current share price is below cash per share on the balance sheet, a deep discount to the $6+ tangible book value.
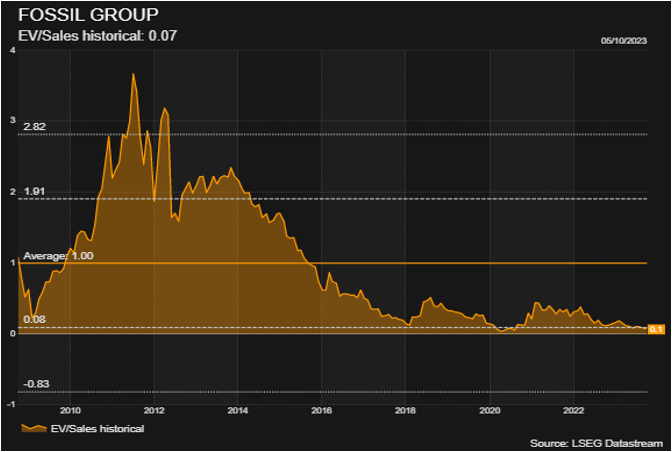
Their net asset reproduction value remains in excess of $1B. Success on the transformation plan would likely mean significant upside potential, possibly 5 to 10x the current share price as normalized free cash flow should be greater than the current market capitalization. For comparison, we would highlight Tapestry, Inc.’s (TPR) recent acquisition of Capri Holdings (CPRI) in the luxury marketplace at an Enterprise Value to Revenue multiple of 1.5x, significantly higher than Fossil’s current valuation at less than .1x, suggesting significant embedded value potential from a successful transformation.
Recently, the Deep Value Select strategy achieved its 5-year anniversary. Over the past 5 years, the strategy has generated annualized returns net of fees of +27.8% versus S&P 1500 Value Index at 8.1%. What makes us excited about the future is that more than 75% of our historical investment returns have been generated by investments that are no longer in the portfolio. We have redeployed these historical successful investment gains into new investment opportunities and increased positions in holdings that have lagged the overall portfolio. We believe the Deep Value Select strategy is unique, providing clients significant exposure to severely mispriced small-cap equities today. The Deep Value Select strategy is a very concentrated portfolio investing mostly in significantly mispriced cyclicals and companies going through multi-year transformations. Our investment holdings tend to be significantly out of favor, leading to a limited number of analysts following the companies, and allowing us to take advantage of greater marketplace inefficiencies. While some of our investments may require a longer investment time horizon, we believe market expectations for the strategy’s investments remain extremely low and hold the potential for significant improvement in future operations and valuation expansion.
We thank our clients for their ongoing long-term partnership and remain focused on generating attractive long-term returns.
Dan Lysik, CFA
October 6, 2023
Deep Value Select Strategy Composite Performance (%) as of 9/30/2023
| QTD | YTD | 1-Year | 3-Year | 5-Year | Since Inception (10/1/18) | |
|---|---|---|---|---|---|---|
| Deep Value Select Strategy (Gross of Fees) | 15.77% | 9.37% | 47.63% | 43.78% | 29.04% | 29.04% |
| Deep Value Select Strategy (Net of Fees) | 15.50% | 8.56% | 46.21% | 42.40% | 27.78% | 27.78% |
| S&P 1500 Value Index | -4.20% | 6.98% | 21.41% | 13.68% | 8.12% | 8.12% |