
Miller Deep Value Select 4Q 2023 Letter
The past year was a surprisingly strong year for the equity market and in many ways the opposite of 2022. 2023 started with inflation rates well above the long-term average and increased market volatility and the bank failures of Silicon Valley Bank and Signature Bank. Marketplace fears of a potential recession rose significantly during this time period, and roughly coincided with the start of the outperformance of the “Magnificent 7.” The largest 7 market cap companies were the media darlings throughout the year for their market-leading equity returns, and ended 2023 with a combined return of +107%, driving a significant portion of the equity index returns. During the back half of 2023, the rate of inflation fell more than initial market expectations which also supported equity returns. The progress on reducing inflation was acknowledged by the Federal Reserve, who recently highlighted that their rate hiking cycle may be ending. The marketplace quickly shifted expectations and by year-end seems to be discounting significant interest rate cuts over the coming year as well as favoring a soft landing as the more likely economic scenario, other things being equal. The changes in market perception around interest rates, inflation, and recession risk have not only had a positive impact on equity returns, but have also led to divergences within the equity market.
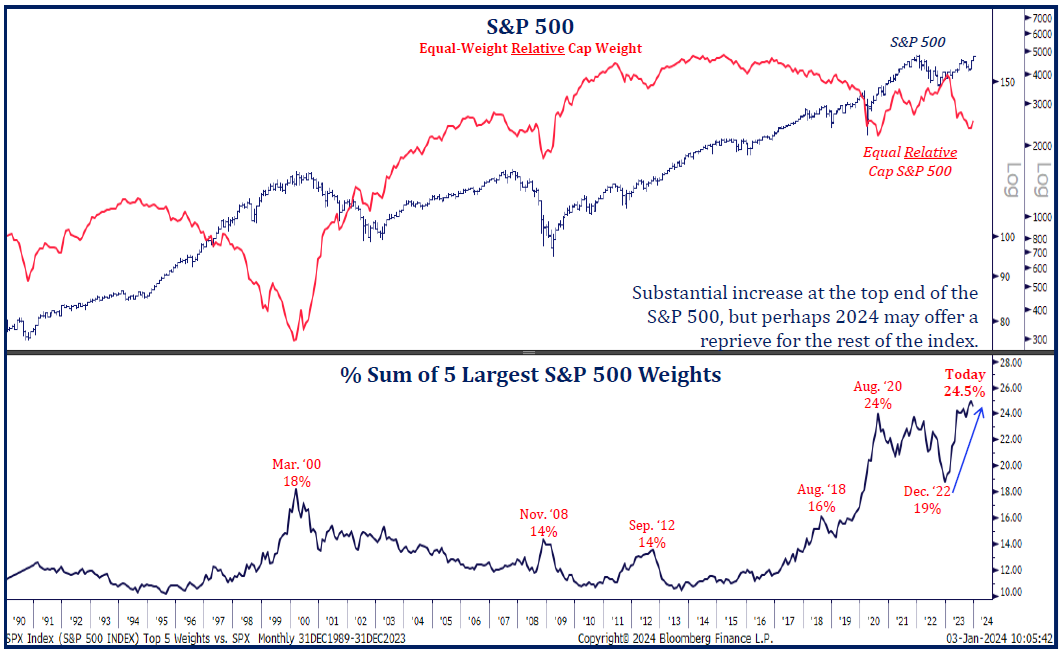
The greater marketplace uncertainty early in the year and growing interest in artificial intelligence seemed to me to lead market participants to favor mega-cap technology companies. Market concentration, which had significantly pulled back during 2022, reversed course and increased at a rate last seen in 2020. The sum of the 5 largest S&P 500 weights increased from 19% at the end of 2022 to 24.5%, now above the previous August 2020 24% peak! The S&P 500 equal weighted index outperformed the cap weighted index early 2021 through end of 2022. That two-year outperformance was reversed over the past 12 months. As you can see from the top chart, S&P 500 Equal weighted stocks relative performance ended the year close to the Covid-era 2020 lows. The last couple of years has some similarities to the late 1990s, when market participants favored larger market caps and marketplace concentration increased, with the top 5 collectively reaching 18% of the S&P 500 Index.
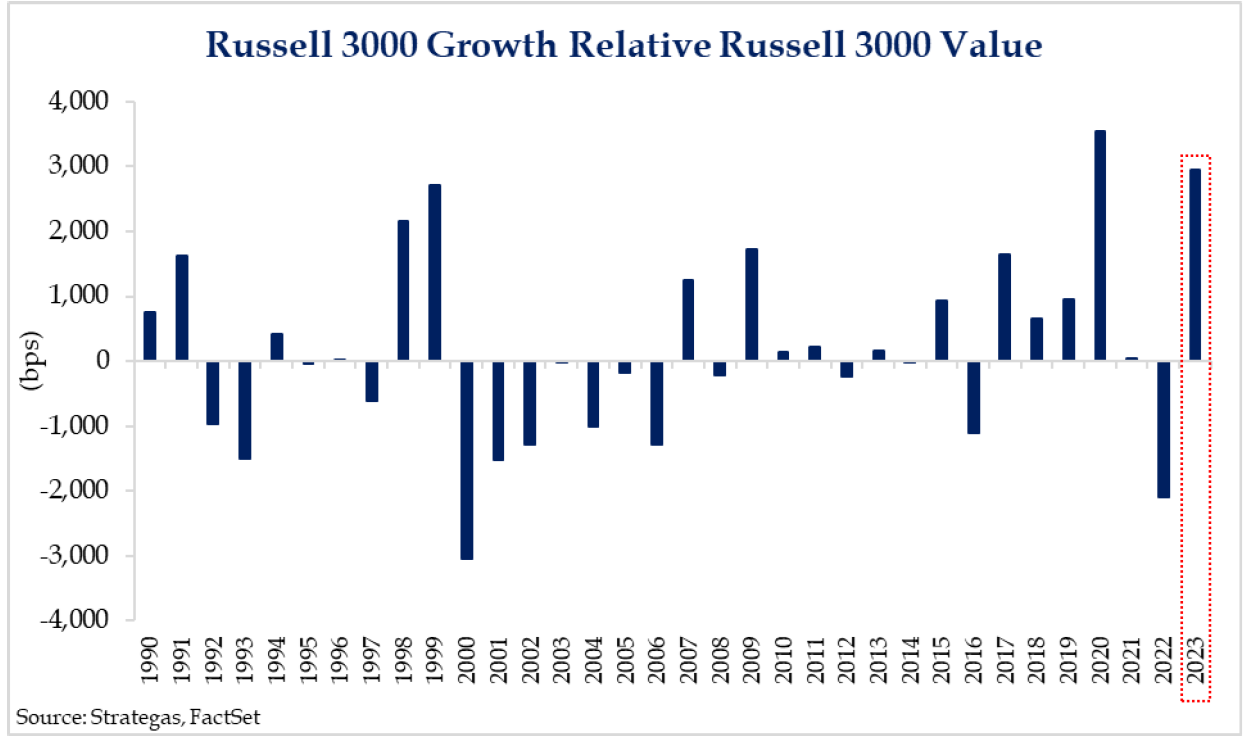
Last year, Growth stocks had one of its best years versus Value stocks. After significantly underperforming in 2022, the Russell 3000 Growth Index increased +41.21% while Russell 3000 Value Index increased +11.66%. As the chart below highlights, the performance spread between the two was nearly 30%! The second largest margin over the past 33 years, only surpassed in 2020!
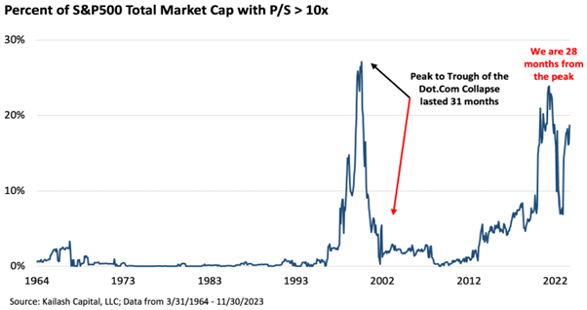
The longest-duration equities also reinflated last year. The chart below by Kailash Concepts Research highlights the percent of S&P 500 Index total market cap of equities with price-to-sales ratios in excess of 10x, ended the year near 20% (only higher during the brief time periods of 1999/2000 and 2020)! A closer look at this subset would reveal a sizable number of holdings within the Technology sector.
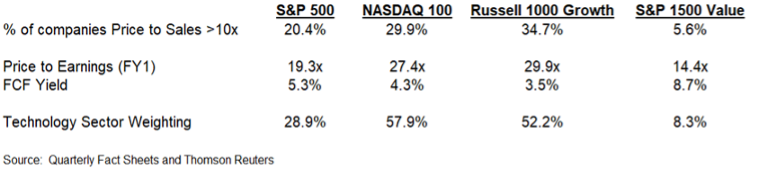
Technology stocks led the equity market in 2023 increasing +57.8%. At year end, the sector’s valuation premium versus historical average is approaching 50%, forward price-to-earnings of 26.7x versus 20-year average of 17.9x. The sector is handily at the largest valuation premium in the marketplace. The greater Technology representation in the more growth-oriented indexes, NASDAQ-100 and Russell 1000 Growth, are also driving the higher valuation multiples for those indexes.
With the strong outperformance of growth stocks last year, it is not surprising to see the recent outperformance has widened valuation spreads between growth and value stocks. While the divergence can always get wider (as we saw in the late 1990s), historically wide spreads have eventually led to mean reversion. It is also worth noting that the marketplace is already discounting six rate cuts for 2024 and the 10-year bond yield has pulled back to 4%. Longer duration equities have seen some recent valuation expansion due, in my view, to these market moves. Similar to the past, crowded higher valuation equities could become vulnerable to two risks apparently not discounted in the market today: a higher-than-expected level of future inflation (similar to the re-accelerations that followed initial reductions in the inflation waves of 1910-1920, 1940-1951 and 1972-1982) or weaker than expected future earnings due to possible lagging effects of recent interest rate hikes.
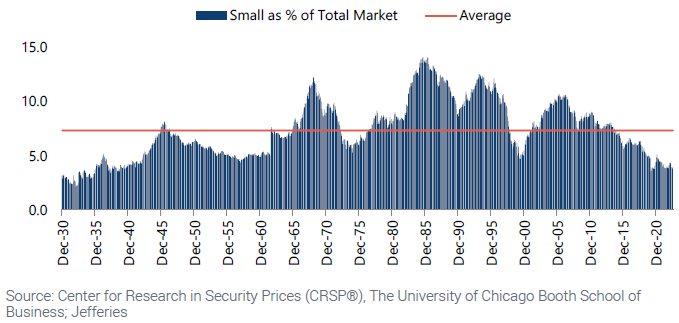
Along with low valuation securities, small caps continue to look compelling from my perspective. With the significant valuation expansion of the larger market caps, small cap is now less than 4% of the U.S. equity market. As the chart below highlights, below 4% is a rarity looking back over the past 100 years. The previous occurrence was the Covid 2020 period and, prior to that, the 1930s! Market expectations remain extremely low for small cap equities, as they have underperformed for the past 10 years.
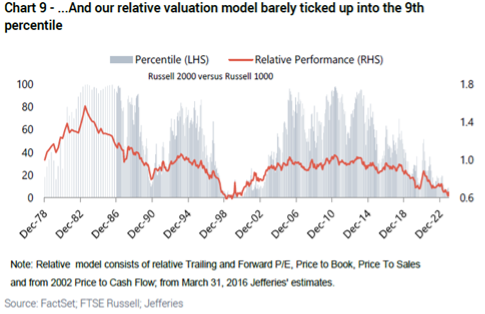
Market participants who focus on recent historical returns could be missing their attractive valuation and historical longer-term outperformance since 1978. Small Cap relative valuation is now back close to 1999/2000 trough levels. From 2000 to 2006, small cap value generated cumulative returns of +186% versus large cap growth of -26%. As the market broadened out in the second half of 2023’s the fourth quarter, small cap stocks were one of the strongest performers. Low valuation securities and small cap value appear very attractive and timely and should be an ongoing beneficiary from a broadening of the equity market!
Strategy Highlights
For the fourth quarter, the Deep Value Select strategy return net-of-fees was +1.67%, trailing the S&P 1500 Value Index +13.70%. The underperformance for the quarter was due to a weaker October and September as the smaller cap holdings in the strategy saw significant valuation contraction. The strategy saw a nice recovery during the month of December. Due to the weaker Q4 performance, the Deep Value strategy’s year-to-date net return is +9.86%, also behind the S&P 1500 Value Index return of +21.64%. However, the Deep Value Select strategy achieved its 5th consecutive positive performance year and is nicely ahead of the S&P 1500 Value Index in the trailing 3, 5 years and since inception time periods net-of-fees.
Deep Value Select Strategy Composite Performance (%) as of 12/31/2023
| QTD | YTD | 1-Year | 3-Year | 5-Year | Since Inception (10/1/18) | |
| Deep Value Select Strategy (Net of Fees) | 1.67% | 9.86% | 9.86% | 18.36% | 33.92% | 22.82% |
| S&P 1500 Value Index | 13.70% | 21.64% | 21.64% | 12.99% | 13.98% | 10.38% |
Past Performance is no guarantee of future returns. The Miller Deep Value Select strategy incepted 10/1/2018. Performance periods greater than one year are annualized. The “gross” of fees performance figures reflect the day-weighted performance of assets (including cash reserves) managed for the period and do not reflect the deduction of our investment management fees or performance fees but do reflect the deduction of trading commissions and withholding taxes. Throughout this document, the “net” of fees performance figures reflect the deduction of trading commissions; withholding taxes; the reinvestment of dividends, interest and other cash flows; a model performance fee; and a model investment management fee equal to the maximums under our fee schedule for Deep Value Select separate accounts. The following is our fee schedule for new Deep Value Select strategy separate accounts (as reflected above): the model performance fee is 20% of the account’s performance, after the investment management fee has been deducted, above a 6% hurdle rate; the model investment management fee is 1.00% on all assets under management. These model fees have been deducted from the gross returns on a monthly pro-rated basis to arrive at the net of fee performance shown above. Historical separate account investors may have paid lower fees than the model fees used to calculate “net” of fees performance here. The model performance fee is calculated and accrued on a monthly basis and paid out annually. For important performance information, please reference the Deep Value Select GIPS Composite Disclosure.
During the quarter, our largest positive contributor was Western Alliance Bancorp (WAL), whose market price was up more than 40%. Western is a leading national commercial bank with a capital-light business model. The company appears to me to be positioned for long-term growth at the high end of their peer group. WAL has industry-leading underwriting (as evidenced by their low loss rate) and return on assets, which, in my view, support their 18-20% target return on common tangible equity target.Consensus expectations remains in the 15% range potentially providing a nice ongoing variant. Western’s mortgage business is also a “hidden asset” not being sufficiently recognized in the company’s current share price in my opinion. At more than 10% of their company revenue and near trough profitability, any future recovery in the mortgage market from lower interest rates could provide greater future earnings power. WAL’s shares remain attractively priced with a price-to-estimated earnings ratio (FY2) below 7x, a 40% discount to its historical long-term average and a greater than 30% discount to their banking peer group.
Nabors (NBR) and Gannett (GCI) were the two largest detractors during the quarter. The market price of Nabors shares was down more than 30% in the fourth quarter due to the recent weakening of commodity prices, which increased marketplace fears that rig utilization rates may fall further over the coming months. The company is positioned to be a beneficiary over the next couple of years from the ongoing global recovery in energy capital spending in my estimation. I also believe Nabors has significant international business that is not being appreciated by the marketplace. Their joint-venture (JV) with Saudi Aramco alone could add 5 rigs per year over the next 10 years, with each rig possibly contributing more than $10M in Earnings Before Income, Taxes, Depreciation, and Appreciation (EBITDA). In addition, as their proprietary drilling solutions and energy transition businesses further scale up it should lead to greater free cash flow (FCF) conversion given their lower capital intensity. Since the beginning of 2018, management has focused free cash flow on debt reduction, eliminating nearly $2B in debt. Nabors’s balance sheet risk has diminished, with limited near-term maturities and net debt leverage ending 2023 close to 2x. Company valuation levels are near historical extremes, Enterprise Value to EBITDA (2024 estimated) (EV/EBITDA) of only 3.6x, market cap near 1x cash flow and a normalized FCF yield greater than 50%. Nabors appears severely mispriced to me, and we have been taking advantage of the recent share price weakness by adding to our position.
Gannett shares also pulled back during the quarter. Management’s transformation plan remains on track in my view. Their digital offerings and new content partnerships are growing nicely, as they approach 50% of revenue, which may lead to an eventual inflection to positive company revenue growth. The company has an opportunity to monetize their 180M+ monthly unique visitors, developing new subscription revenue and cash flow streams over time. The New York Times, which has a smaller audience reach than Gannett, undertook a similar successful transformation 10 years ago that lead to accelerating revenue growth and free cash flow generation. As their transformation progressed over that period, The New York Times valuation expanded, price-to-sales multiple increased from less than .5x to 3.2x and Enterprise Value to EBITDA from near 7x to 21x.
Gannett’s share price today presents a similar long-term opportunity as it implies no value from a successful transformation. Gannett’s valuation multiples are near all-time lows, price to sales multiple of .13x and an EV/EBITDA near 5x. Ongoing operational progress and debt reduction has the potential to accelerate free cash flow generation and unlock significant equity value overtime. In addition, Gannett’s anti-trust lawsuit against Google is underappreciated in my view as it has the potential to further accelerate the transformation. Winning the case could result in a reward in excess of $1B (anti-trust suits awards can be triple damages). Gannett remains one of our larger holdings, with significant embedded long-term appreciation potential with business value significantly above current share prices.
Since inception, the Deep Value Select strategy has generated annualized returns net-of-fees of +28.03% versus S&P 1500 Value Index at +10.38%. Out of 35 total investments over that period, we have exited 19 for profit (including the most recent successful exit of Chicos (CHS)), while 5 have been at a loss. Over the past 12 to 18 months, we have redeployed net proceeds from historical investments into new opportunities and increased positions in current holdings that continue to offer compelling return potential in my view. As investors in businesses, we want to minimize our average cost basis by adding to positions on weakness, thereby capitalizing on the greater discount to business value and larger long-term return potential.
We believe the Deep Value Select strategy is unique in providing clients significant exposure to what in our view are severely mispriced and under-followed small-cap equities today. While some of our investments may require a long investment time horizon, we believe investors with a long-term view that aligns with ours will benefit. We believe market expectations remain too low for the portfolio’s names, and there is potential for attractive long-term returns if improvement in company operations continues, and valuation expansion follows. The Deep Value Select strategy currently has a normalized free cash flow yield in excess of 30% and valuations at historically attractive levels; we believe the strategy offers compelling return potential and is timely for those seeking value exposure in their portfolio. We thank our clients for their ongoing long-term partnership and will remain steadfast in navigating near-term volatility to focus on generating long-term returns.
Dan Lysik, CFA
January 7, 2024