The equity market last year had a lot of similarities to 2023. The S&P 500 was up more than 20% for the second consecutive year (a rarity, last seen in the 1990s). Momentum and concentration were the common theme for the fourth quarter and 2024 as the top ten stocks in the S&P 500 Index ended the year at another record concentration level: a 38.7% weighting. The “Magnificent 7” continued to lead the market, generating +48% returns last year after posting +76% returns in 2023. As the chart below highlights, their earnings have been supported by profit margins expanding from 15% back to 2021 peak levels of 23.5%.
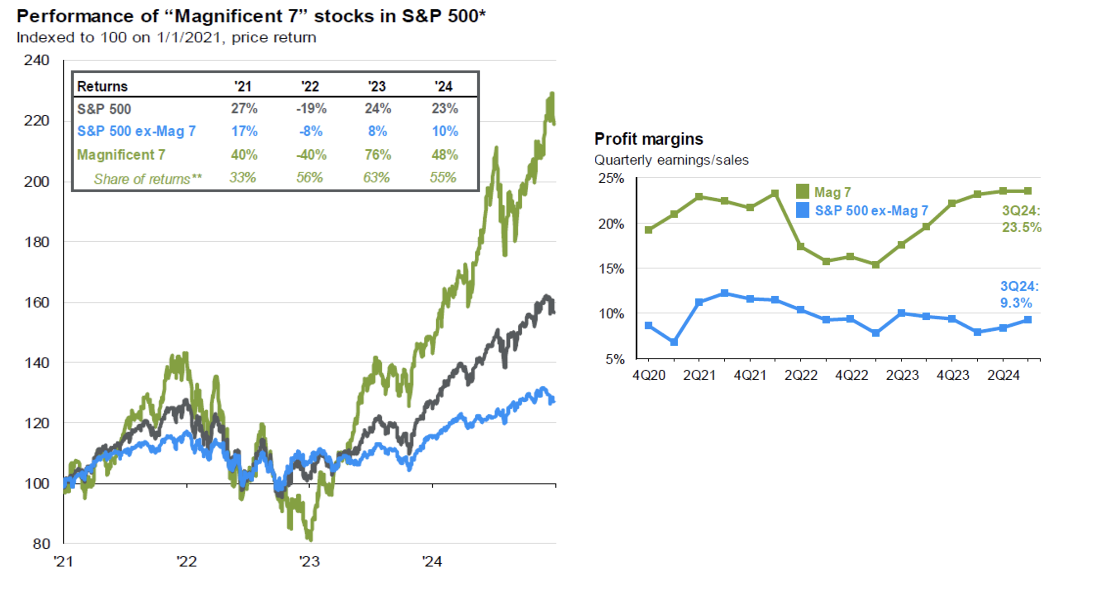
Market participants have also crowded into these securities, pushing their valuation multiples back towards multi-year highs. The last time we were near these valuation levels, 2021, the Magnificent 7 forward price-to-earnings multiples corrected back to the low twenties, leading to a 40% drawdown in 2022 and an 11% headwind to S&P 500 Index 2022 returns. As of 12/31/2024, their collective forward earnings yield is under 3%, a significant discount to the 4.68% 10-year yield. Mr. Market appears to be discounting significant long-term benefits of AI and the continuation of double-digit earnings growth well into the future. With valuation multiples and profit margins at the higher end of their historical range, there is a growing risk of another valuation contraction cycle, potentially triggered by any unforeseen disappointment on future earnings or weaker-than-expected free cash flow due to escalating capital expenditures. Given the Mag 7’s lofty 33.5% weighting in the S&P 500 Index and 55.8% in the Russell 1000 Growth Index at year-end, an unexpected double-digit percent drawdown in the future could create a sizable headwind for future Index and passive returns.
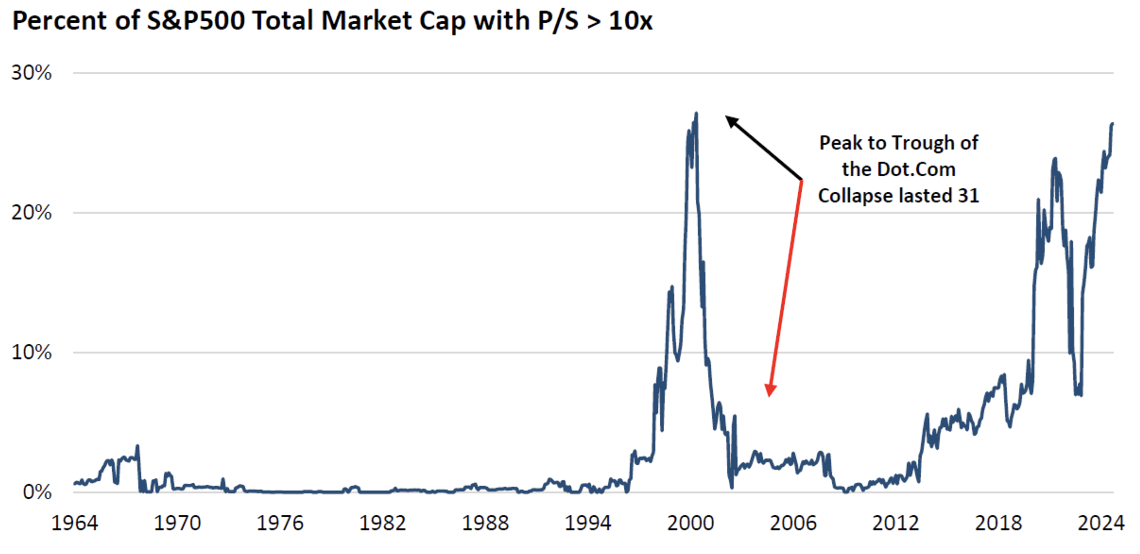
Back in 2021, we highlighted in our letters the significant valuation expansion and growing concentration of longer duration equities in the marketplace. Historically, equities with a price-to-sales greater than 10x have underperformed the market over longer time periods. During 2021, nearly 25% of the S&P 500 Index weighting had a price-to-sales greater than 10x. Their representation fell over the following year as valuation multiples contracted and the market broadened out, favoring lower valuation securities. However, as the chart below highlights, over the past year, long duration equities have surpassed 2021 levels as longer duration equities are now approaching peak levels last seen in 2000. Taking a closer look at the companies that make up price-to-sales at >10x, one would not be surprised to find a significant number of technology stocks.
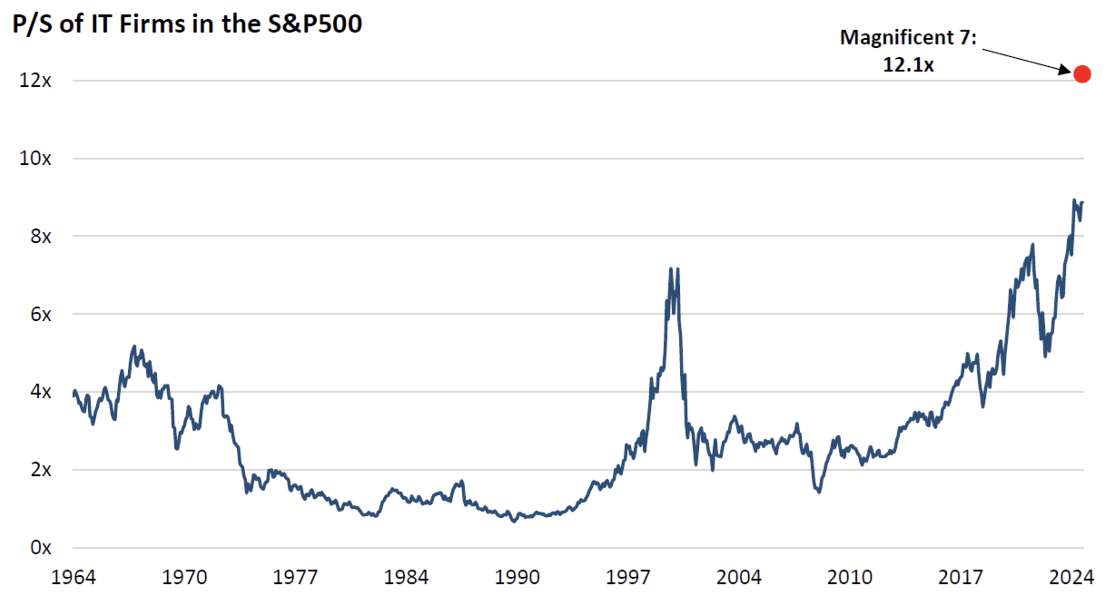
The S&P 500 Technology sector closed the year with a nearly 32.5% weighting of the S&P 500 Index (59.7% weighting in the Russell 1000 Growth Index), at the higher end of historical valuations levels, a forward earnings yield approaching 3% (nearly 40% below its 20-year average), and a record price-to-sales above 9x and a 30x cash flow multiple. Market expectations appear very high!
Meanwhile, low valuation securities and smaller market cap equities are being significantly overlooked as evidenced by their near record low representation in broader indexes. Increasing exposure to these areas today provides investors diversification benefits and has the potential to generate attractive future absolute and relative returns if and when the market eventually broadens out. Below is a recent chart highlighting the correlation of S&P 500 trailing price-to-earnings multiple with Large Cap Growth performance to Value.
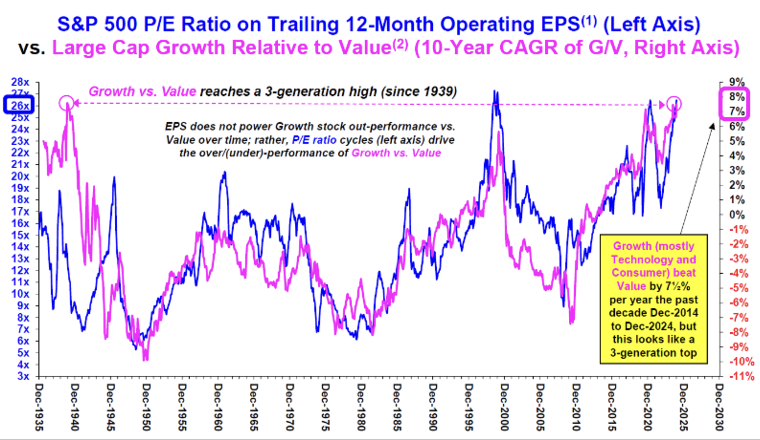
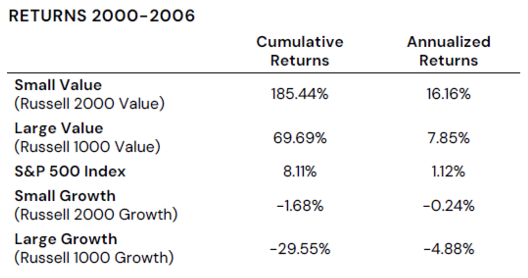
Outperformance by longer duration equities over time has led to greater concentration in the S&P 500 and eventually valuation expansion. Including the recent year-end, Growth led Value by 7% per year for the past decade! With Growth stocks outperformance in 2023 and 2024, we are back at generational extremes. As the chart above highlights, value stocks significantly outperformed their growth counterparts post the early 2000 extreme. The performance spread between Large Cap Growth and Small Cap Value is worth noting: 214% cumulative / +21% annualized over 7 years! While it is possible that growth stocks valuation can expand further in the near-term, like the 1999-2000 time-period, valuation multiples have historically eventually reached a ceiling as the discount rate continued to rise. As Warren Buffett famously quoted “the market is a voting machine in the near-term and a weighing machine in the long-term.” With wide valuation spreads between the lowest valuation and longest duration equities, in our opinion, low valuation equities provide investors with an attractive long-term reward versus risk opportunity with a significant “margin of safety.”
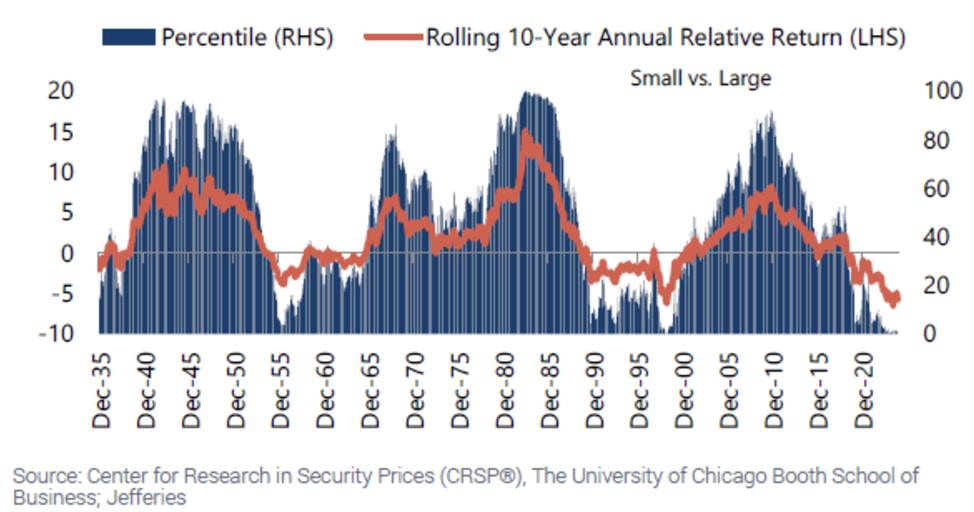
As the valuation chart below highlights, small caps’ relative performance is also near all-time lows. Small Cap versus Large Cap rolling 10-year returns are now in the first percentile! The last time we were at these levels was early 2000. Looking back at the Great Recession, stocks versus bonds rolling 10-year returns were also negative in early 2009, just before the S&P 500 embarked on a strong multi-year absolute and relative outperformance cycle.
Over the past 2 years, small caps stocks have been in a prolonged earnings recession leading to significant relative underperformance. However, looking forward we see growing probability for small cap earnings to reaccelerate and it’s even possible they may lead the overall marketplace later in 2025 into 2026. The new administration will again likely focus on deregulation, which should become a tailwind for small companies who have historically been the most adversely impacted by the excess regulation. In addition, smaller caps have greater cyclical sector exposure, and their earnings have historically been highly correlated with ISM manufacturing index. After 2 years of moving sideways near historical lows, the ISM Index is showing signs of reaccelerating which could have a favorable impact on small cap future earnings. Given their recent underperformance it is not surprising to hear that smaller caps are significantly under-owned, less than 4% of total equity market cap (near 100-year lows), which is half of its long-term average. In fact, the five largest companies combined market cap ended the year at nearly 5x the entire Russell 2000 market cap, also a new record!
While it is impossible to predict near-term market moves, history suggests that low valuation equities and small caps appear to be presenting a compelling long-term generational opportunity!
Miller Deep Value Select Strategy Highlights
During the quarter, the Miller Deep Value Select strategy generated net returns of +3.59% ahead of the S&P 1500 Value Index’s -2.30% and the S&P 600 Value Index’s +1.43%. For 2024, Deep Value Select Strategy net returns were +24.45%, ahead of the S&P 1500 Value Index at +12.15% and the S&P 600 Value Index at +7.56%. During the month of December, low valuation securities and small caps underperformed as the marketplace favored longer duration equities and mega-cap Technology stocks. The Miller Deep Value Select strategy’s recent performance continues to benefit from its very high active share and focus on investing in businesses whose share prices are only a fraction of our estimate of long-term fundamental value.
Miller Deep Value Select Strategy Composite Returns
 >
>Past Performance is no guarantee of future returns. The Miller Deep Value Select strategy incepted 10/1/2018. Performance periods greater than one year are annualized. The “gross” of fees performance figures reflect the day-weighted performance of assets (including cash reserves) managed for the period and do not reflect the deduction of our investment management fees or performance fees but do reflect the deduction of trading commissions and withholding taxes. Throughout this document, the “net” of fees performance figures reflect the deduction of trading commissions; withholding taxes; the reinvestment of dividends, interest and other cash flows; a model performance fee; and a model investment management fee equal to the maximums under our fee schedule for Deep Value Select separate accounts. The following is our fee schedule for new Deep Value Select strategy separate accounts (as reflected above): the model performance fee is 20% of the account’s performance, after the investment management fee has been deducted, above a 6% hurdle rate; the model investment management fee is 1.00% on all assets under management. These model fees have been deducted from the gross returns on a monthly pro-rated basis to arrive at the net of fee performance shown above. Historical separate account investors may have paid lower fees than the model fees used to calculate “net” of fees performance here. The model performance fee is calculated and accrued on a monthly basis and paid out annually. For important performance information, please reference the Deep Value Select GIPS Composite Disclosure.
During the quarter, the Strategy’s largest positive contributor was Quad Graphics (QUAD), whose market share price was up +54%. Quad had its inaugural analyst meeting in November, highlighting progress with their long-term transformation to a marketing experience company. The company has new capabilities and can now offer customers a more extensive suite of services versus competitors. The company has also invested over the years in their modern open architecture proprietary data stack that has significant embedded value. Quad’s extensive proprietary data has greater than three billion household attributes on 250 million consumers, 92% of U.S. households and 97% of U.S. adult consumers. Google recently partnered with Quad, looking to combine their search data to create new AI automated segmentation opportunities for the marketplace. Quad is also building a growing presence in large retail media networks (estimated by the company at greater than $100B by 2027). The company has established access to the hardware and software for in-store displays. As more mid-sized retailers roll-out the new displays over the next couple of years, Quad is working to expand their consumer audience reach which they plan to monetize over time through new advertising and consumer branding efforts. As new business initiatives further scale, Quad’s Media Integrated Solutions will begin to offset the large-scale print secular headwinds, ideally allowing the company to return to revenue growth. The company’s EBITDA margins should also benefit from a mix shift to Media Integrated Solutions, which are expected to generate margins in the high teens, nearly twice the level of their large-scale print offerings. We believe Quad shares remain significantly mispriced trading near 4x 2025 Enterprise Value to EBITDA versus RR Donnelley acquisition price at 6.8x and Omnicom’s recent acquisition of IPG at 8.5x. A recession over the coming quarters would be a near-term risk along with any unexpected shortfall in their long-term transformation plan. Quad’s long-term upside appears to us to be multiples of the current share price as the company has a greater than 40% normalized free cash flow yield.
Our two largest detractors during the quarter were Nabors Industries (NBR) and Gray Media (GTN), whose market share prices were down 11% and 40% during the quarter. Both company’s share prices appear to be at deep discounts to their long-term fundamental value; we have recently increased position sizes in both holdings.
With the pullback in commodity prices last year and increased industry consolidation there has been growing fear that Nabors will experience greater operational pressure on their North American rig business. While the recent industry consolidation has led to some near-term choppiness in industry capital expenditures, we believe the North American rig market should stabilize over the coming quarters and there is potential for incremental rig deployments over the next 6 to 12 months. However, international market has been more resilient. Nabors has signed contracts for a 20% increase in their international working rig fleet over the coming 2 years. In addition, Nabors’s joint venture (JV) with Saudi Aramco will continue to scale over the next couple of years with 4-5 new rigs added each year. Over the next two years, the JV free cash flow should see a nice positive delta from cash use to positive free cash flow generation. Finally, the company’s NDS (“Nabors Drilling Solutions”) division has market leading technology and strong global growth opportunities. The company recently announced a merger with Parker Wellbore which will nearly double the size of their NDS segment. With very low capital intensity and high free cash flow conversion, Nabors NDS segment should support accelerating future free cash flow generation. While there is some near-term risk on weaker-than-expected domestic drilling expenditures, we see these risks significantly discounted in the current share price. Nabors’ share price looks extremely attractive, ending the year below 1x forward cash flow (approaching their Covid 2020 all-time lows), greater than 50% normalized free cash flow yield and forward Enterprise to EBITDA multiple approaching 3x. We believe long-term upside potential for Nabors is several times the current share price.
Gray Media was under pressure during the quarter, as company political advertising fell below market expectations as a higher level of spending took place in markets outside of Gray’s station footprint. However, the company continues to generate strong free cash flow as management recently announced $500M debt repurchase programs. While the company has higher debt leverage, Gray has limited maturities over the next two years. The company’s assets remain strong and under-appreciated, #1/#2 ranked TV stations in 90% of their markets. Also, marketplace expectations for Gray’s future retransmission revenues remains very low providing a nice ongoing variant. At year end, the company announced that they successfully renewed all ABC affiliation agreements for a 4-year term. We also believe Gray’s shares carry limited value from any potential enhancements to industry regulations or future incremental revenue from ATSC 3.0 (industry new IP standard) deployment. This past week, Gray announced a new JV with leading industry peers that will leverage the broadcasters network architecture and the new ATSC 3.0 transmission standards to provide high speed data transmission to cars, trucks, drones, marine vessels, phones, tables, and television sets. The JV will be targeting data transmission for automotive connectivity, content delivery networks and enhanced GPS. The combined efforts have a greater than $7B combined addressable market opportunity. Near-term risk remains from the unexpected advertising recession; however, we see this as less likely given pent up advertising due to crowding out from political advertising and NFIB strong recent improvement in small business optimism. We estimate Gray has the potential for more than $2B of free cash flow generation over the next 5-6 years that would support allowing the company to de-lever their balance sheet and accrue value to the equity holder over time. With Gray’s current market cap below 2025 operating cash flow and a fraction of book value, we see long-term upside potential multiples of the current share price.
While the marketplace continues to crowd into mega-cap and longer duration equities, Miller Deep Value Select follows a different approach that has had historical success in generating above-market returns over the long term. It is not uncommon these days to see thirty to fifty analysts covering the largest market cap companies and only a handful of analysts covering out-of-favor small and micro-cap equities. Our Strategy focuses on the latter, companies we see as significantly mispriced, whose market share prices at time of purchase tend to be 50-80% below their all-time highs. Given the significant dislocation and depressed market price, the marketplace tends to overlook a company’s sizable asset base (margin of safety). These securities have little or no representation in passive indexes, tend to be under-followed by Wall Street given their multi-year historical challenges, and are at valuation levels well below their peers or private market transactions. Our long-term focus on turnaround situations (cyclicals or multi-year transformations) allows us to develop extensive proprietary knowledge over time on our investment’s asset base and business model. In most cases we are identifying multiple value drivers to support a significant improvement in earnings, free cash flow, and valuation expansion. We also focus on management’s ability to further enhance long-term shareholder returns with capital allocation decisions.
With only 11-13 historical holdings on average, our top five holdings tend to represent more than 50% of the portfolio, so it is not unusual for the Strategy to have volatility of returns on a monthly or quarterly basis. Miller Deep Value Select is not focused on short-term returns but on structuring the portfolio to maximize long-term returns. Since inception, Miller Deep Value Select has had success in generating more than 23% net annualized returns and 2024 was Deep Value Select’s sixth consecutive year of positive returns. Today we remain very excited about the strategy’s current holdings and their long-term embedded opportunity. We have recycled capital from mostly successful historical investments into new investments or holdings that have lagged the overall Strategy’s historical returns. Miller Deep Value Select combined portfolio holdings ended the year near 2x cash flow, a price-to-sales less than .2x, and normalized earnings and free cash flow greater than 30%.
We thank our clients for their long-term partnership and remain focused on delivering attractive long-term returns.
Dan Lysik, CFA
January 9, 2024