
Deep Value Strategy 2Q 2022 Letter
As we have seen in the past, the market does not like uncertainty, and so far, 2022 has had plenty. Market volatility continued during the second quarter as the marketplace expanded its list of market fears. Earlier in the year, it was a wave of the Covid variant “Omicron.” Then Russia invaded Ukraine, which further pressured global supply chains and commodity prices. Inflation hit 40-year highs and, most recently, an inverted yield curve signaling a possible upcoming economic recession. It is no surprise with these significant macro events that the market would see a drawdown. In fact, the first half of the year was the fourth largest drawdown on record for the S&P 500 Index. Stock prices discount future expectations, which was very evident in the first half of the year as S&P 500 earnings were up more than 7%. However, this was more than offset by approximately a 25% valuation contraction in the market’s forward Price to Earnings (“P/E”) multiple. While starting the year greater than 20x, the second quarter closed with the market P/E multiple back near its long-term average of 16x. The significant valuation contraction started earlier in the year with longer-duration equities as interest rates followed inflation higher, causing an increase in discount rates. However, as we moved through the second quarter, cyclical and smaller cap companies also experienced significant weakness as recession fears increased in the marketplace.
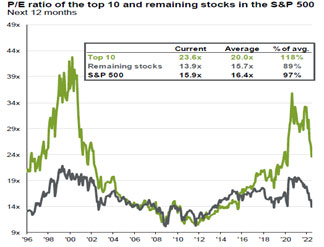
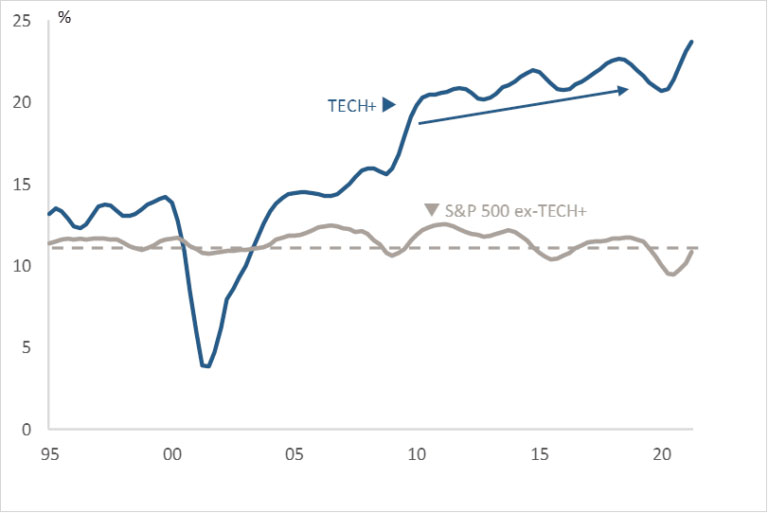
As the chart below highlights, the market remains bifurcated after the recent pullback. The 10 largest market caps in the S&P 500 price to earnings is 23.6x, still at a premium to its historical average. In addition, the S&P 500 Index concentration in the 10 largest holdings remains near 28%, still above the peak in early 2000. However, the bottom 490 companies P/E multiple is now under 14x (similar to 2018 & 2020 lows) and is below its long-term average. The broader market is now providing investors with an attractive >7% earnings yield. Looking even deeper into the S&P 500 Index one can see how the marketplace volatility and fear of a recession is creating a significant opportunity for investors, as low valuation securities and cyclicals appear to be “on sale”. Over the past 6 months, the marketplace has crowded into Defensive equities.
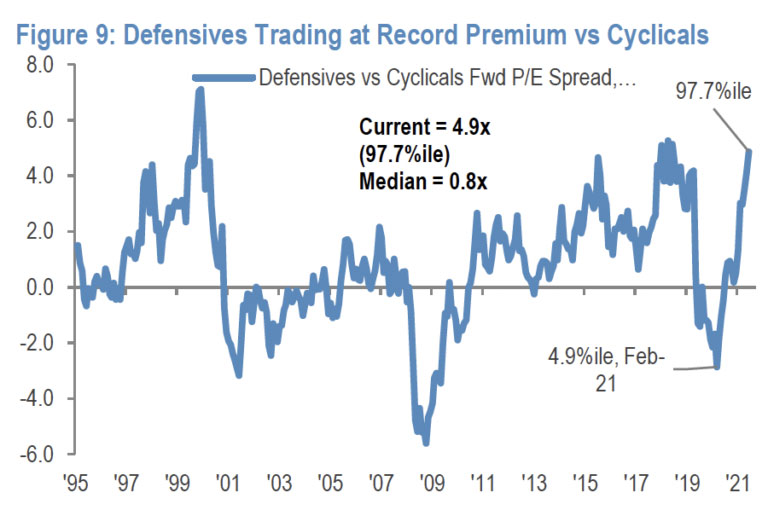
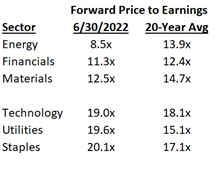
As the chart below highlights, looking at the past 30 years, Defensive equities P/E is approaching a 5-point premium to Cyclicals, a 97.7% percentile ranking (levels last seen in late 2018 and early 2000). The table below shows the significant divergence within sectors of the S&P 500. The cyclical sectors (Energy, Financials and Materials) currently have very attractive high single-digit to low double-digit earnings yield! Meanwhile, the S&P 500 Technology, Consumer Staples and Utility sectors remain at a premium to their historical averages, with forward Price to Earnings multiples of 19-20x. While generally cyclical companies’ earnings would likely be negatively impacted if we experience a deep profit recession, the current lower valuation levels and wide valuation spreads within the marketplace suggest that a significant amount of this risk is already being discounted. In addition, the marketplace appears to be overlooking the potential operational leverage benefits these companies may receive from higher inflation and higher interest rates.
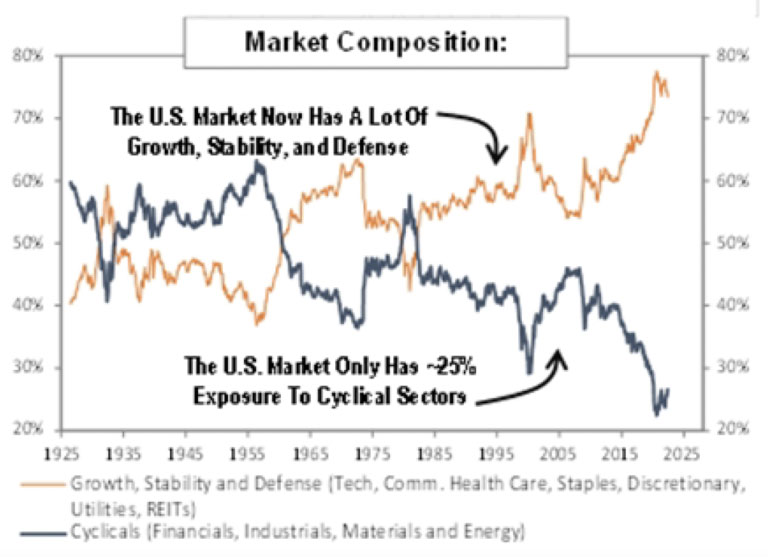
As the chart below highlights, Financials, Industrials, Energy and Materials representation within the S&P 500 Index, collectively remains near 25%, down from 40% nearly 5 years ago! Looking back at history, the cyclical sector weighting troughs in 1974 and 2000 also coincided with wide valuation spreads (similar to today). However, those inflections were followed by a 1000bps+ increase in cyclical sector weightings over the following 5+ years. History has shown that the eventual reallocation from Growth, Stability, and Defense areas of the marketplace can be significant near its extremes.
There are a couple potential drivers that may allow the cyclical sectors to remain on a recovery path. First, cyclical companies’ operating leverage is generally positively influenced by inflation and rising interest rates. With a larger portion of their cost structure being fixed versus variable, there is greater profit leverage potential from a 1% rise in revenues. Energy, Financials, and Materials have historically had the highest operating leverage and could be beneficiaries if inflation stays above a 2% annual rate for an extended period of time. Due to lower valuation multiples, Cyclical sector weights in the S&P 500 Index are currently less than their earnings contribution. As an example, the Energy sector has less than a 5% weighting, yet they are expected to have more than 9% contribution to S&P 500 Index earnings this year. Finally, Technology is the largest sector in the S&P 500, nearly 27% weighting in the S&P 500 Index. With the current environment, we see some potential headwinds that could dampen the sectors future growth. Technology is the sector that has the greatest foreign sales exposure, nearly 60% of sector revenues which could continue to experience headwinds from the dollar at 20-year highs and any demand weakness abroad. Also, as the chart below highlights, S&P 500 ex-Technology/Financial profit margins remains near historical 30-year averages. However, the Technology sector Earnings Before Income and Taxes (“EBIT”) margins are significantly higher than the overall market (at 25+ year highs).
The Technology sector also has a greater variable cost structure that may be more vulnerable to wage pressures from an ongoing tight labor market. The sector’s higher absolute and relative valuation multiples and historically high profitability levels could lead to a lower sector weighting over the coming quarters if the underlying company revenue and earnings disappoint market expectations. Unlike other cyclical areas of the market, the Technology sector’s current weighting is also higher than their current earnings contribution. Finally, Growth investors are generally still very concentrated in Technology; the S&P 1500 Growth index has a 41.8% weighting at quarter-end, nearly 3x the next largest sector! As we have highlighted in previous letters, cyclicals appear to remain under-owned and have a much greater representation in Value indices, with most having weightings 50% higher than the S&P 500 Index.
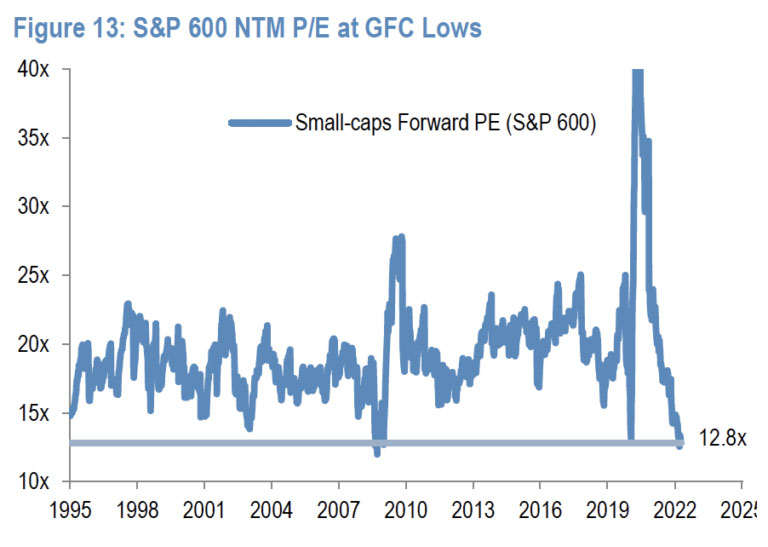
One other significant dislocation (a.k.a. opportunity) to highlight is smaller market cap companies. The small cap index had one of its worse second quarters in its history and its fifth worse first half of the year looking all the way back to 1932. As the chart below highlights, the small cap index also experienced significant valuation contraction (approximately 25%), with its P/E multiple pulling back to lows last seen during the Great Financial Recession. Looking at the Value and Growth subsets within the small cap universe one will still see valuation spreads in excess of 50% between the two cohorts. With an earnings yield approaching 10%, the small cap value index appears very attractive and is at absolute valuation levels that have historically led to attractive forward one-year returns.
While the market has become very concerned with the potential for an economic recession, we offer a timely contrarian view. Low valuation, cyclical, and small cap securities appear to already be discounting a significant amount of this market fear. While there can continue to be near-term weakness, we believe the current dislocation is providing a great long-term opportunity. In prior market corrections and recessions, cyclicals and small cap value equities have bottomed well before the economic cycle trough and have typically led the market during the early part of the recovery.
Where could we be wrong with this view? A deep and prolonged profit recession could lead to further downside in the equity market over the coming months. Also, a resurgence of Covid-19 or further escalation of the conflict in Europe could weigh on global demand leading to further crowding of perceived safety and defensive securities. However, as we highlighted previously, there are parts of the marketplace that may also see revenue and earnings pressure in an economic slowdown that are not being discounted in equity prices today and valuation spreads remain near historical wide levels (longer duration equities still have valuation compression risk). Secondly, while we expect inflation rates to lessen as the year progresses, we may see inflation remain at levels higher than market expectations. U.S. consumer and corporate balance sheet appear healthy when compared to history. Ongoing structural constraints remain in place, and a healthy labor market may lead to a longer inflation cycle. There are numerous signs that suggest Value could do well over the coming years: low absolute and relative valuation multiples, ongoing wide valuation spreads, low market expectations, and Value’s significant under representation in the marketplace.
Strategy Highlights
The Deep Value Strategy had a very disappointing second quarter experiencing significant valuation contraction during the period. For the quarter, the Deep Value Strategy was down more than 30%, significantly lagging the S&P 1500 Value Index and the overall market. For the year, the Strategy is down about 10%, ahead of the S&P 1500 Value Index and the overall market.
During the quarter, nearly half of the portfolio holdings were down more than 30%. The Strategy only had 2 positive contributors during the quarter, Chicos (CHS), and American Axle & Manufacturing (AXL). Chicos, a turnaround retail investment, is being led by new CEO, Molly Langenstein. She has done a wonderful job in repositioning the company’s three banners (Chicos, White House Black Market, and Soma). The enhancements made to each brand’s merchandise has resonated well with its target consumer. We see significant growth potential over the coming years as Chicos returns to historical revenue and margins levels and Soma executes on their growth plans to achieve $1B in revenue.
The auto industry has some similarities to the Energy sector a couple of years ago. It is significantly out of favor with a growing imbalance between supply and future demand. There is potential for a significant replenishment cycle in the U.S. over the coming years. American Axle (AXL) is a tier 1, vertically integrated supplier, well positioned for a recovery in the North American auto market (nearly 80% of revenues) and should benefit from ongoing consumer demand in the large truck marketplace (half of its revenue). AXL’s share price remains significantly mispriced at less than 2x cash flow and approximately 50% normalized free cash flow yield.
Our two largest detractors during the quarter were Gannett (GCI) and Quad Graphics (QUAD). Both companies’ share prices were adversely impacted by marketplace fears on a future pullback in advertising and marketing services over the coming quarters due to economic weakness. We continue to believe Gannett’s multi-year transformation plan to transition from an analog to digital media company has an opportunity to unlock significant equity value. We see limited value in the share price for the company’s Business-to-Business, digital marketing services (DMS) platform and Business-to-Consumer platform, which should generate high-margin, reoccurring subscription revenue over time. In addition, we believe Gannett’s sports medium, national events business, and sports betting operation are underappreciated assets. With a Price-to-Sales now less than .2x, the marketplace appears to be overlooking Gannet’s significant asset base and future free cash flow potential.
Quad Graphics has been operating for 50 years and is a leading worldwide marketing solutions provider. The company has developed a larger integrated marketing platform that helps marketers and content creators improve efficiency and effectiveness. Over the years, Quad has used their size and innovation to provide incremental services to their clients and improve their scale and profitability. Management has been operating well and continues to see positive sales momentum, which should allow the company to further accelerate the de-levering of the balance sheet. In addition, a recent market transaction implies that Quad Graphics current market price significantly under appreciates the company’s asset value. We believe there is nice upside potential over the next couple of years at a >70% normalized free cash flow yield valuation. Additionally, with close to $3B in revenue, we believe Quad’s share price looks significantly mispriced with a current market capitalization less than $200M, providing a great long-term opportunity.
We also believe that a lot of Energy equities remain mispriced. The sector generated negative returns in four of the last six years (2015, 2017, 2018, and 2020). Even with a strong 2021 and start to 2022, the Energy sector 10-year returns at the end of the 2nd quarter are only 4.3% versus 18.7% for Technology and 13% for the overall S&P 500. Our two energy holdings – Nabors Industries (NBR) and TechnipFMC (FTI) – are oil service companies that recently experienced multi-year trough conditions. Given the delayed industry Capital Expenditure (“capex”) recovery, both companies have only recently seen higher utilization rates, improved pricing, higher margins, and growing backlogs. It is also important to note that their revenue isn’t directly tied to a commodity price but to industry capital spending trends. Both management teams see a multi-year positive industry capex cycle with oil prices greater than $70/share. Nabors and TechnipFMC share prices are still 75% below their 5-year highs, at low single-digit cash flow multiples, and normalized free cash flow yields in excess of 30%. Both companies have significant price-to-value gaps that offer the potential to generate very positive long-term returns.
It is rare to see significant drawdowns in the market over a quarter time period. Since WWII, a S&P 500 Index drawdown of more than 15% in a quarter has only happened 9 times. The positive news is that on these prior 9 occasions the S&P 500 Index average 6-month forward return was +15% and average 1 year return was +26%, with positive returns in every occurrence. We looked back at the Deep Value Select historical quarterly returns and have seen two other quarters of drawdowns of more than 15%, Q4 2018 and Q1 2020. The Deep Value Strategy average 6-month forward return from these two drawdowns was greater than +50% and 1-year return was greater than +100%. While it’s disappointing to have significant drawdown quarters, we have historically been able to recover over the following 6-12 months. It is difficult to predict the timing of the performance inflection; however, we believe our holdings remain significantly mispriced, now at deeper discounts to their fundamental value. We believe the Deep Value Strategy valuation characteristics today are at a very attractive 60% to 90% valuation discounts to the Market and S&P 1500 Value Index. The current holdings ended the second quarter nearly 50% below their 52-week highs. The Deep Value Strategy’s long-term embedded return potential is also approaching early 2020 levels, suggesting the potential for attractive long-term absolute and relative returns.
We appreciate your patience during these volatile times. We believe our clients have the potential to benefit over the coming years from the significant price to value gaps in our current holdings.