
Deep Value Strategy 1Q 2019 Letter
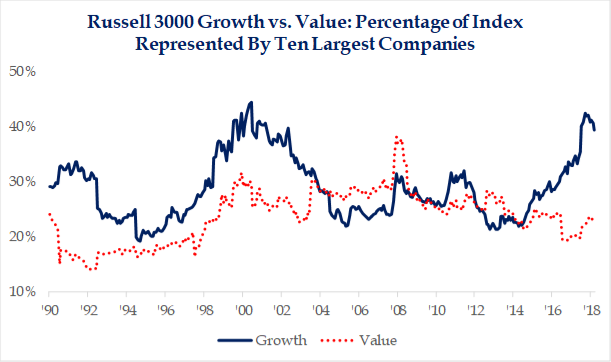
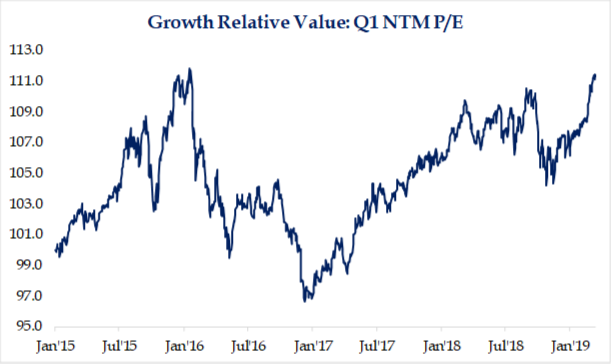
What a difference three months makes! As 2018 ended, so too did the indiscriminate selling which took place during the fourth quarter. The year started out on a more positive note with most equity markets generating double-digit returns during the first quarter. However, as the quarter progressed, market participants returned to some of the same investment themes we highlighted in our 4Q 2018 investor letter. Growth continued to lead the marketplace across all market capitalization ranges. Given the recent outperformance by Growth stocks, it’s not surprising to see a greater concentration in the overall indices and relative valuation levels back to historically high levels last seen in early 2016 and 2000. The recent market volatility has also lead to greater crowding into low volatility securities as non-cyclical sectors (bond surrogates) quickly returned to their September 2018 highs. Mr. Market seems even more short-term focused, purchasing perceived “Safe Havens”, with the 10-year bond yielding around 2.5% (a 40x P/E multiple) and Growth stocks with an earnings yield approaching 4% and 7x book value. However, we remain long-term oriented focused on the attractive value opportunities that remain overlooked and underappreciated by the marketplace.
After a difficult 4th quarter, Deep Value Strategy and Concentrated Deep Value Strategy bounced back up 15.3% (net of fees) and 20.6% (net of fees), respectively, versus the S&P 1500 Value index return of 11.6%. Stock selection was the main driver of positive performance, as 30-35% of the portfolios were up in excess of 30% during the quarter. Performance detractors to the Strategies came from our two Telecom industry holdings and a couple of holdings within the Consumer Discretionary and Energy sectors. With portfolio holdings at extremely attractive valuation levels, we have historically been the beneficiary of private equity or other companies recognizing value. During the past 12 months, Rent-A-Center and SuperValu each were acquired at prices 50%+ over its market price at the time of announcement and 100% above 52-week lows. We were able to redeploy the proceeds into new mispriced names that have the potential to make a positive contribution to future performance.
Over the past 20 years, we have found that significant security mispricings can occur with companies in cyclical industries. A large divergence may exist between a company’s market price and intrinsic value when the marketplace questions its competitive position or the overall industry experiences a cyclical downturn. Equity prices may significantly underperform over short time periods as near-term earnings and free cash flow fall below normalized levels and valuation multiples compress to historical troughs levels. During these time periods, we have found the marketplace will tend to over-extrapolate near-term profit trends assuming these pressures continue into the future with little potential for economic recovery. Gaining a deep understanding of a company’s asset base, business model and management capital allocation provides the confidence to invest in these severe dislocations. Focusing on normalized free cash flow and earnings power for the enterprise, we are able to determine the price gap between the current market price and the company’s underlying fundamental value. In some instances, we are able to uncover through our analysis hidden assets that have been overlooked in the marketplace, which provides an additional margin of safety for our investment. While the market is focused on the near-term, taking a long-term investment view can lead to an attractive asymmetrical return profile.
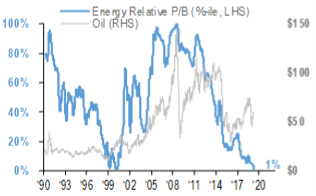
The Energy sector is a good example of a current out-of-favor industry. September 2018 through year-end, oil prices corrected from more than $70/barrel to around $50/barrel. The weakness in the commodity price was magnified in individual energy share prices, which fell in some cases in excess of 50%. Market participants quickly remembered the industry pain during the 2014-2016 downturn. However, as the chart below highlights, oil prices have quickly recovered back above $60/barrel. Energy company market prices remain dislocated, and most have not fully participated in the commodity price recovery. Excessive market fear remains as the Energy sector relative price-to-book versus the market is currently at 1% percentile, a 30-year low last seen in early 2000! Relative industry valuation levels are BELOW levels that were experienced when oil was $30/barrel! We don’t share the market’s pessimistic view and see significant return potential in our Energy holdings over the next couple of years. Collectively, our Deep Value Energy holdings are near historical trough absolute valuation levels – 60-70% discount to book value versus their historical averages of a premium to book!
Another cyclical investment we recently made was Western Digital (WDC), a market-leading hard disk drive manufacturer and data storage company. Western Digital recently acquired SanDisk, further building out their mobile storage and flash memory offerings. In our opinion, the marketplace became overly concerned on near-term industry weakness and overlooked Western Digital’s low-cost position, innovation pipeline and long-term growth dynamics of their end markets. Western Digital has a 20%+ cost advantage per bit versus peers in the NAND flash memory market and recently enhanced their cost position. The company has also had a long history of market innovation, spending $2B+ a year on research and development (“R&D”), which is more than 10% of their company revenue. As industry fears intensified, Western Digital’s share price fell into the mid-30s; at these levels, R&D spending was greater than 20% of the equity market capitalization providing limited value contribution for future innovation. At its price low, nearly every valuation measure for Western Digital was approaching a historical trough and the company’s stock price was less than book value and nearly half their revenue. Taking a long-term view, we saw a very favorable reward/risk opportunity set as Western Digital’s market price was at a low-single-digit normalized price-to-earnings multiple and normalized free cash flow yield that was greater than 20%. The stock was purchased in both of our Deep Value Strategies and scaled up into price weakness, with the belief that the near-term cyclical fears were more than discounted into the share price. While the stock has recovered 40% from its recent lows, we continue to see nice upside potential over the next couple of years and believe the company’s market price can still appreciate 50-75%+ as profitability stabilizes and revenue, earnings and free cash flow recover towards normalized levels.
On occasion, the marketplace becomes so concerned about the pressures on a company’s business model during a cyclical downturn that it overlooks the significant value of the company’s asset base and balance sheet strength. During these time periods, the market tends to forget that the company owns the business and the assets. In our opinion, Bed Bath & Beyond (BBBY) and GameStop (GME) are two such examples.
As we mentioned in our 3Q 2018 letter, BBBY has undertaken a multi-year transformation plan. While disruptive in the near-term, the company continues to generate strong free cash flow, nearly $600M in 2018 and has more than $1B in cash and short-term investments on the balance sheet or nearly $8/share. The company has spent nearly $1B over the past couple of years upgrading technology systems and enhancing infrastructure. As the transformation approaches completion, the company’s operating margins should begin to expand, allowing for the continuation of strong free cash generation and acceleration of earnings growth. Management is currently targeting >$600M in share repurchase over the next two years (at current prices that would lead to a 25% reduction of the share base). The company also has a significant asset base ($6B) that is not reflected in valuation levels which remain near trough levels (3x EV/EBITDA and .25x EV/Revenue). This is well below recent private equity transactions in the retail sector. Over the next 3-5 years, we see the potential for double-digit earnings growth and see current shares very attractive at less than 5x normalized earnings and greater 20% normalized free cash flow yield.
GameStop, the world’s largest video game and gaming console retailer, has been under pressure over the past couple of years as the company has experienced weakness in its physical gaming business. GameStop recently sold their Spring Mobile business to Prime Communications. The recent transaction significantly enhanced GameStop’s balance sheet, providing more than $700M in cash. Upon closing the transaction, GameStop has $1.6B in cash, with net cash of $8/share nearly equal to the current share price! We see the company leveraging its market-leading position in the video game industry to expand into the rapidly growing Esports marketplace. The company recently announced new partnerships with some of the industry-leading participants (CompLexity, Envy, and Infinity Gaming). GameStop Performance Center, a new public gaming center, will be located in the home of the Dallas Cowboys to also help build the company presence. The company also recently appointed George Sherman as CEO. George is a retail industry veteran who has been a part of successful retail transformations, including building out Best Buy’s services business which included Geek Squad. While nearly all of GameStop’s stores remain cash flow positive, we would expect George to look at additional ways to enhance the company’s growth and profitability over the coming years. In our opinion, GameStop looks significantly mispriced; the company’s EV/EBITDA is currently less than 1x as enterprise value is approximately $150M. It’s worth mentioning that this past year the company generated $8B in revenue, $2B in gross profits and $232M in free cash flow. In our opinion, GameStop’s current market price appears to be inputting significant negative value for their physical game business, disregarding their market-leading position in the video game industry, growing digital/collectibles business, and strong balance sheet ($800M net cash, land and buildings that are currently carried on the balance sheet for more than $600M, and $1B+ of inventory that is current in nature). With the significant share price weakness, we would expect management to accelerate share repurchases over the coming year and see significant appreciation potential over the next couple of years as new initiatives take hold and marketplace fears subside.
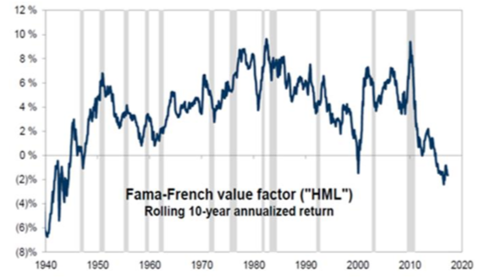
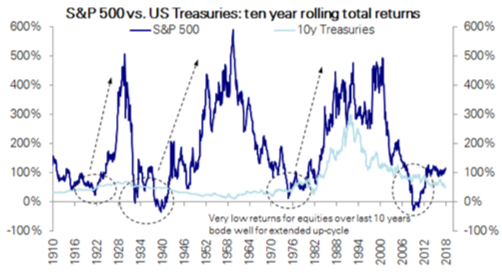
While investors currently pay a premium for stability and growth, we see a significant dislocation and opportunity in lower valuation securities in the marketplace today. Rolling 10-year returns for low valuation securities currently look like early 2000 and reminds us of the S&P 500 in early 2009! Looking back at those time periods, we know how attractive value returns were from 2000-2005 and overall equity market returns from 2009 to today.
While the overall market is close to historical highs and above historical average valuations, our Deep Value Strategies holdings are near multi-year lows and remain at a significant valuation discount. The portfolios’ holdings are collectively 40% below their 52-week high and at valuation levels that are well-below the overall market and significantly below their long-term averages. We remain excited about our Strategies embedded return potential and believe we are well-positioned to generate returns in excess to the overall market over the coming years.
Daniel Lysik, CFA
| Valuation Characteristics | Deep Value | Concentrated Deep Value | S&P 500 |
| # Holdings | 49 | 20 | 500 |
| % Below 52-Week High | -38.9% | -44.2% | -10.7% |
| Return to 52-Week High | +63.7% | +79.2% | +12.0% |
| Current Price-to-Book (P/B) | .54x | .42x | 3.09x |
| 15-Year P/B Average | 2.15x | 2.60x | 2.75x |
| Return to 15-Year Average | +298% | +519% | -12% |
| Current Price-to-Cash Flows (P/CF) | 1.97x | 1.42x | 12.04x |
| 15-Year P/CF Average | 7.74x | 9.05x | 10.40x |
| Return to 15-Year Average | +293% | +537% | -16% |
| Current Price-to-Sales (P/S) | .22x | .16x | 2.15x |
| 15-Year P/S Average | 1.32x | 1.21x | 1.65x |
| Return to 15-Year Average | +500% | +656% | -30% |
Daniel Lysik, CFA manages two strategies: Deep Value Strategy focuses on out of favor securities at very low valuation levels and deep discounts to their intrinsic value, whose current market price does not reflect the companies normalized earnings for free cash flow power, and Concentrated Deep Value Strategy, which is the most deeply mispriced subset of the Deep Value Strategy and typically provides greater exposure to lower market capitalization holdings. Email us for more information and how to invest.