
Deep Value Strategy 1Q 2022 Letter
It’s been an interesting start to 2022! The year started with market worries related to the Omicron variant becoming more widespread and potentially weighing on the ongoing economic recovery. As we reached mid-February these fears began to lessen. Unfortunately, it was a short-lived reprieve as Russia invaded Ukraine on February 24th, creating further stress on global supply chains. The market’s concerns about inflation, which became more apparent in the second half of 2021, now also had to contend with the disruptions in Europe and rising global geopolitical concerns. Market fears about inflation increased dramatically during the quarter as inflation rates approached levels not seen in over 40 years. As we highlighted in our Q3 2020 Quarterly Letter “Value: A Timely Opportunity,” the significant Federal and fiscal stimulus after the initial Covid outbreak dramatically increased the money supply. These actions have historically led to future inflation being above historical averages. With the reopening of global economies (demand recovery), ongoing supply chain issues, and a tight labor market, there continues to be upward pressure on inflation. Historically, Value securities have done quite well during inflationary time periods and that was the case during the quarter as Value led Growth by a wide margin.
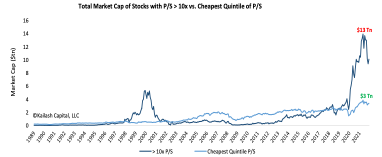
Longer duration equities and bonds started the year at extreme valuation levels – 50-100x+ price-to-earnings multiples. With the market having recently treated them as “perceived safe havens,” there appears to be ongoing risk of capital loss from any unforeseen valuation contractions. During the quarter, the significant increase in inflation and rise in interest rates started a rerating of longer duration securities. Revisiting Kailash Capital’s chart from our Q3 2021 quarterly letter “The Weighing Machine Should Tilt in Value’s Favor,” one can see how long duration equities fell from $13Tn to $10.1Tn during the quarter (see chart below). However, the total market capitalization of companies with price-to-sales greater than 10x is still more than 3x the cheapest valuation quintile. The longest duration equities market prices still appear to be discounting very lofty future growth expectations well into the future, leaving them vulnerable to any future growth or profit disappointments or further rise in interest rates.
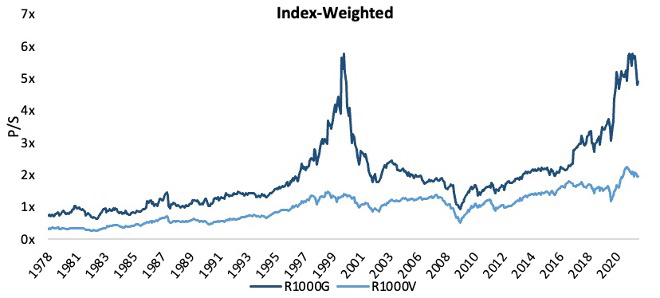
The ongoing wide valuation spread, can also be seen looking at the price-to-sales multiples of the Russell 1000 Growth and 1000 Value Indexes. Growth indices have significantly higher exposure to the longest duration equities and remain not far away from recent historical extremes. The growth universe has generated strong historical earnings and free cash flow growth for most time-periods since The Great Recession. Longer duration equities have also benefitted from a considerable amount of valuation expansion over the past couple of years as a direct result of record low interest rates (lower discount rate). However, when we look back at time periods following significant accommodation by the Federal Reserve and fiscal stimulus, we have seen a greater likelihood that inflation could stay above historical averages for longer periods of time. Lower valuation equities appear to be in a favorable position and should continue to lead in the marketplace as valuation spreads narrow over time.
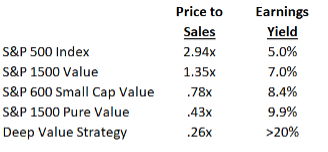
Even within the Value universe, valuation spreads remain wide as we believe smaller market caps and pure value indices are at a significant discount. As you can see from the chart below, the S&P 1500 Value Index price-to-sales is more than half of the S&P 500 Index. The S&P Small Cap Value Index price-to-sales is at >70% discount to the market. Finally, the S&P 1500 Pure Value Index price-to-sales is at a >80% discount to the S&P 500 Index and an even greater discount versus the more expensive portions of the marketplace. On an earnings yield basis, the Pure Value Index is nearly 2x the overall market and significantly higher than the more expensive portion of the market which has an earnings yield below the 10-year bond yield! The Value universe still has the potential to benefit from improving operating results and valuation expansion. In some cases, companies may have significant embedded businesses that are being carried at a fraction of public market prices providing a long-term investor significant upside potential along with a sizable margin of safety as the market eventually takes notice.
Where could we be wrong with this view? During the quarter, the yield curve (10-year yield versus 2-year yield) inverted for a short time. Historically, this has preceded a recession by approximately 12 to 18 months as future interest rate hikes eventually weigh on economic growth. However, a recession hasn’t happened every time post a yield curve inversion throughout history. Looking at the 10-year versus 3-month portion of the curve, it is very steep and is not suggesting risk of a recession. Over the past couple of weeks, the curve has re-steepened; a second inversion would suggest greater recession risk. The other potential risks are a resurgence of Covid-19 and even greater geopolitical tensions, which in combination would further weigh on supply chains and economic growth. Given the ongoing war is in Ukraine, there appears to be greater potential risk of a significant slowdown in Europe versus the U.S. The U.S. consumer and corporate balance sheets still appear to be very strong when compared to history, which may provide some offset from higher inflation and rising borrowing costs pressures. While volatility may continue to be high over coming months, we see an environment that should continue to provide a favorable backdrop to lower valuation securities. In some cases, current valuation levels appear to be discounting risks of a greater than expected economic slowdown.
Strategy Highlights:
After a challenging back half of 2021, where the portfolio experienced significant valuation compression, the Deep Value Strategy bounced back and has had a strong start to the year. For the quarter, the Deep Value Strategy was up more than 30%, significantly ahead of the S&P 1500 Value Index and the overall market.
During the quarter, more than half of the portfolio weighting were in holdings that were up in excess of 25%. Our two largest positive contributors were Nabors Industries (NBR), up more than 80% and Tenneco (TEN) up in excess of 60%. Nabors Industries continues to benefit from the rise in oil and gas prices as the industry emerges from a multi-year trough. The company appears well positioned to be a significant beneficiary over the coming years from higher oil prices and greater global demand for their higher spec land rigs. In addition, the company’s proprietary technology offerings have the potential to create significant long-term value. Even after the recent positive move, Nabors remains at a sizable valuation discount to their peers. Nabors pre-split share price at quarter end was only $3/share; historically when oil prices reached current levels, Nabors share price has been in excess of $10/share. Nabors should continue to benefit from paying down debt and free cash flow returning to normalized levels over the next couple of years.
Tenneco benefitted during the quarter from the announcement that Apollo will take the auto supplier private at a 100% premium to its current market price. While the recent supply chain issues have weighed on the auto industry and supplier companies, Tenneco became significantly mispriced, and we were fortunate to have increased our position size in the later part of 2021.
One of our largest holdings was also one our largest detractors during the quarter as Gannett (GCI) was down more than 14%. The company was adversely impacted in Q4 by weaker advertising revenue, inflationary pressures in their newspaper operations, and headwinds from the resurgence of Covid. We continue to believe the company’s multi-year transformation plan to transition from an analog to digital media company has an opportunity to unlock significant equity value. We see limited value in the share price for the company’s Business-to-Business digital marketing services (DMS) platform and Business-to-Consumer platform, which should generate high margin, recurring subscription revenue. In addition, Gannett’s sports medium, national events business, and sports betting operation are underappreciated assets. With a price-to-sales now less than .2x, the marketplace appears to be overlooking Gannet’s significant asset base and future cash flow potential. Management is expecting free cash flow to grow at a 40% Compound Annual Growth Rate (CAGR) through 2025 and recently announced a new share buyback program which at current market prices has the ability reduce the share count by more than 15%. We continue to believe that success of the transformation plan will lead to long-term upside potential in Gannett’s share price, multiples of the current price level.
During the quarter, larger new holdings were TechnipFMC (FTI), American Axle & Mfg (AXL) and Footlocker (FL). TechnipFMC is an energy service provider, a global leader in subsea, offshore and surface projects. The company is known for its technology and innovation leadership within the subsea market. During the multi-year protracted downturn, TechnipFMC focused on building differentiated integrated system solutions for their clients that cover the full life cycle from conceptual design to project execution and finally life of field/maintenance. Their underwater solutions (pre-engineered modular architectures) significantly differentiate the company from its peers and has potential to industrialize the subsea market. In addition, TechnipFMC is well positioned to benefit from the Energy Transition (Offshore floating renewables, GHG removal, and Hydrogen). The enhancements to the company’s offerings and manufacturing footprint are expected to drive efficiencies and double profits over the next couple of years, and free cash flow conversion should show nice improvement as well. TechnipFMC has a strong balance sheet with more than $1.3B in cash and improving debt leverage. With a strong upcycle started for subsea (growing backlog orders) there is potential for considerable share price upside and greater return to shareholders over the next couple of years. The auto industry has some similarities to the energy sector two years ago – significantly out of favor with a growing imbalance between supply and future demand. As the industry sees a transition to electric vehicles (EVs), the marketplace has created a significant wide valuation spread between industry participants. As we previously discussed with our investment in Tenneco, the auto suppliers have been adversely impacted first by the initial Covid outbreak and then by the supply chain challenges that became more visible during last summer. Industry inventory levels remain near all-time lows at 20 days versus at 60-80 days between 2015-2020. There is the potential for a significant replenishment cycle over the coming years.
American Axle (AXL) is a tier 1 vertically integrated supplier focused on automotive propulsion systems to support internal combustion engines, hybrid, and electric vehicles. The share price has significantly underperformed over the past couple of years, down more than 70% below its 2015 highs. The company is well positioned for a recovery in North America auto market (nearly 80% of revenues) and should benefit from ongoing consumer demand in the large truck marketplace (half of its revenue). Similar to Tenneco, American Axle has less exposure to EVs versus its peers. However, the company has been increasing new scalable electrification propulsion technologies. The marketplace appears to be providing limited value to American Axle’s innovation as well as recent new wins which secure more than $10B in revenue from 2025 to 2030. The company’s vertical integration while helping the company operate in the current challenging environment also provides nice contribution margins (more than 25%) as industry volumes improve. Management expects to generate significant free cash flow over the next couple of years. AXL’s share price looks significantly mispriced at less than 2x cash flow and approximately 50% normalized free cash flow yield. Upside potential could be multiples of AXL’s current share price as the company continues focus on de-levering their balance sheet towards 2x net debt leverage target.
Finally, Footlocker (FL) came under significant pressure during the quarter, with the stock down more than 50% from its highs and valuation not far from early 2020 lows. Nike continues to place a greater focus on their Direct-to-Consumer business, which will decrease their contribution to Footlocker’s total sales, retreating to historical averages of 50% by 2023. While a near-term headwind to sales, management plans to offset the lost business by expanding distribution to other leading brands, rolling out larger neighborhood free-standing stores, and expanding two new growth banners (WSS & Atmos). WSS stores will provide an off-mall presence and focus on the rapidly growing and underserved Hispanic market. Atmos will provide Footlocker with the ability to expand into Japan and Asia sneaker market with their digitally led business model. These new growth concepts have a combined potential to add more than $1B in sales by 2024. The company’s balance sheet remains very strong with $800M in cash and management is increasing returns to shareholders through raising the dividend by 40% and announcing a $1.2B share buyback (more than 40% of the float at current share prices). With the next 12 to 18 months as a transition period for the company, the share price weakness provides attractive reward/risk investment potential, near 3x Enterprise Value/Earnings Before Income, Taxes, Depreciation, and Amortization (EV/EBITDA) and close to a 30% normalized free cash flow yield.
We remain very excited about the embedded long-term return potential in the Deep Value Strategy holdings today. The Strategy provides highly differentiated exposure to opportunities with significant price-to-value gaps in low valuation securities. In addition to the opportunity in mispriced cyclical investments, the portfolio holdings going through transformations also provide a unique high return potential as they are very similar to overall stock market near trough valuation multiples coming out of deep profit recession. The portfolio has a high active share, in excess of 90%, and significant concentration, with the top 5 names more than 60%. With a normalized earnings and free cash flow yield greater than 30%, the Deep Value Strategy is at valuation levels that have historically led to attractive future investment returns. We believe the Strategy can be very additive to a client’s asset allocation.
We appreciate our clients’ trust and will continue to work hard to generate attractive long-term returns.