
At the end of 2024, we titled our letter Is this a Generational Opportunity, highlighting what we believed to be asymmetric return potential in lower valuation equities and small caps, an opportunity hidden within the concentrated/technology-heavy passive indexes. After about a decade of lagging the market, low-valuation and small caps appear to us to be positioned for what could be a multi-year outperformance cycle. While Tariff fears and rising economic uncertainty caused a headwind early in 2025 – similar to the Covid outbreak in early 2020 – fear subsided as the year progressed and the market began to broaden out in favor of this overlooked subset.
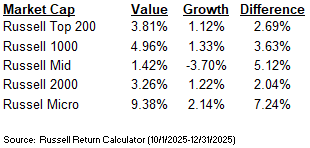
During the fourth quarter, value outperformed growth equities by 269-724 bps across all market caps.
However, market participants remain overly focused on technology and AI related investments. A recent industry study1 highlighted how a basket of the largest 12 AI-linked stocks added approximately $15T of market cap since launch of ChatGPT in 2022. During this time period, these same twelve companies increased revenues by $650B. Their market cap expansion has been nearly 23x higher than revenue growth!1 Many of these companies are now in the top ten weighting in the S&P 500, increasing the largest company concentration from the mid-20s to above 40% over the past three years.
The growth in capital spending among the largest AI hyperscalers has been impressive and may be approaching levels that may cause concern over the coming year. The five largest AI hyperscalers have seen free cash flow as a percent of revenue fall from the high 20s in 2010 to an expected 10% in 2026. Their combined capex spending has increased from $97B per year in 2020 to approximately $400B in 2025 and the expectation of more than $600B by 2027. Technology sector capex as a percent of U.S. GDP is expected to be well above Broadband’s capex peak of 1.2% in 2000. While Mr. Market may continue to reward technology and AI-related equities in the near term, market participants may be facing growing concentration and valuation risk. Longer duration equities appear to be discounting strong growth well into the future. Any disappointment with the rate, timing of growth or return on investment could lead to valuation contraction which could become a significant headwind to future returns.
In our Q3 letter, we highlighted how small cap stocks have been in a multi-year earnings recession with an expected reacceleration in earnings in 2026. During the past quarter, small caps showed some encouraging signs as their earnings growth slightly exceeded that of larger companies, the first time in thirteen quarters! Ongoing rate cuts, deregulation and an estimated $150B of incremental tax savings in early spring could provide additional tailwinds to smaller company profitability. The Federal Reserve restarted the interest rate cutting cycle this past September. Using history as a guide, interest rate cuts have often been a catalyst for better future equity performance, specifically for small cap stocks. Of course, historical examples are provided for context only and are not indicative of future results. Looking back at the past 14 interest rate cutting cycles (back to the 1950s): 15 months after the initial rate cut on average small caps have historically returned in excess of 30% and more than 1500bps ahead of large caps.2
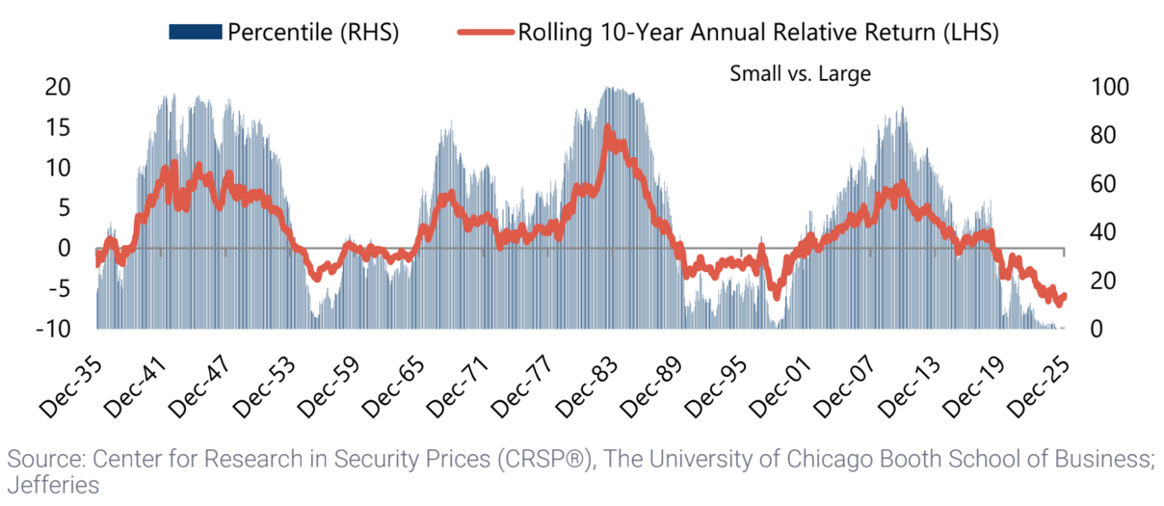
It has been a long 10-year underperformance cycle for small caps. The late 1990s was the last cycle trough which eventually ended as relative valuation multiples narrowed from historical extremes. To start 2026, we are back in the first percentile looking at rolling 10-year performance for small caps versus large caps.
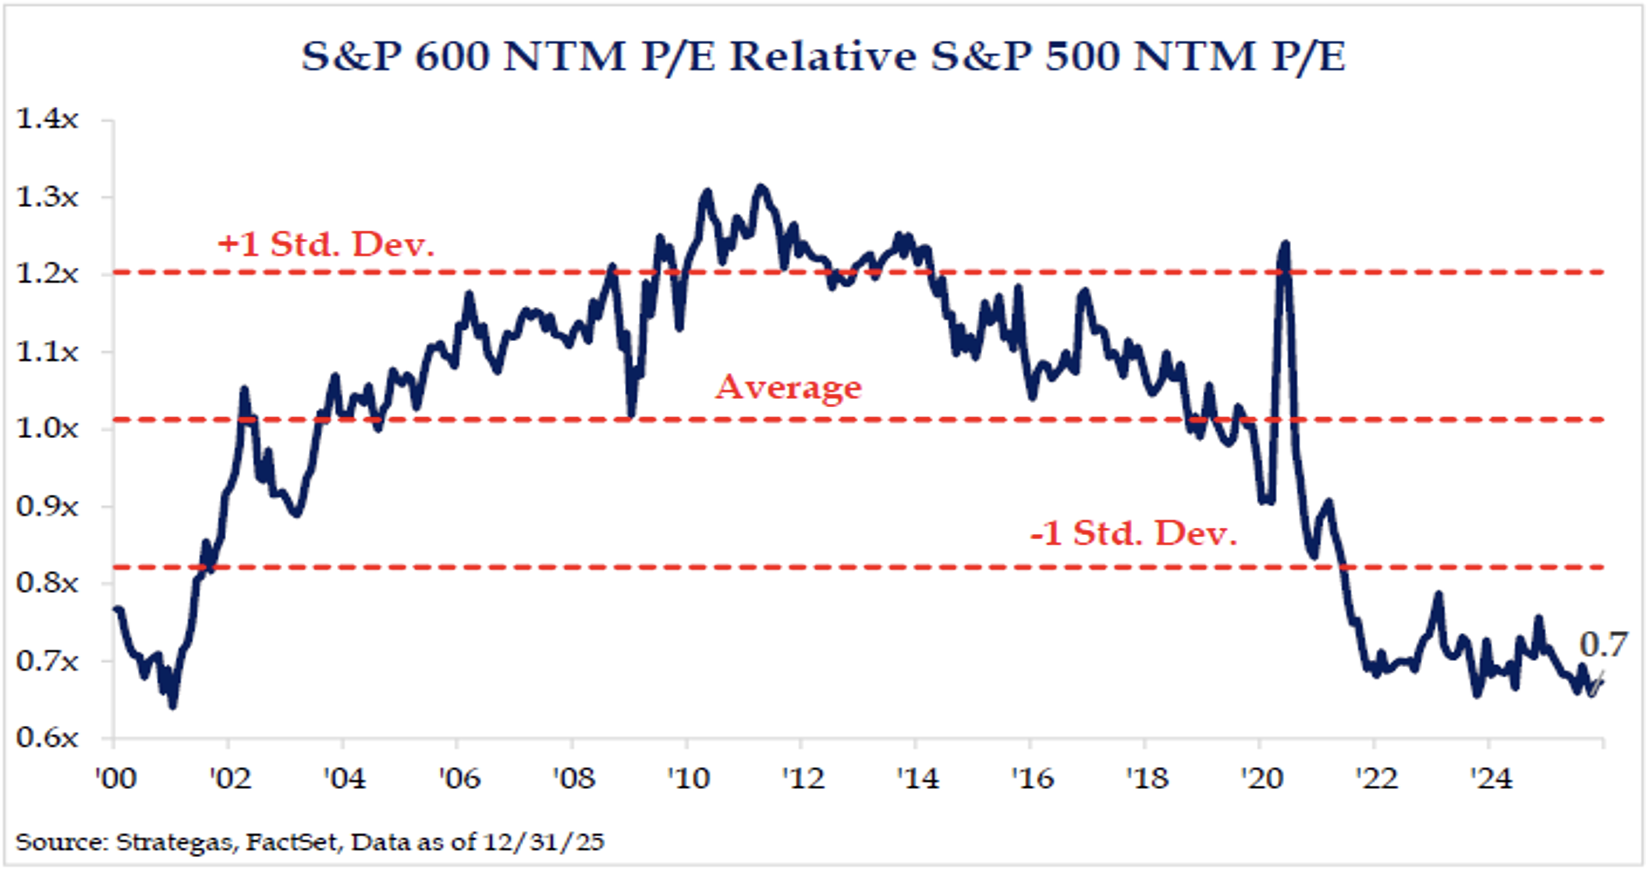
In addition, looking at relative valuation, small caps forward 1-year price to earnings multiples are at a 30% discount to large caps. Current levels are nearly two standard deviations from the historical average, near similar levels to 2000 time period.
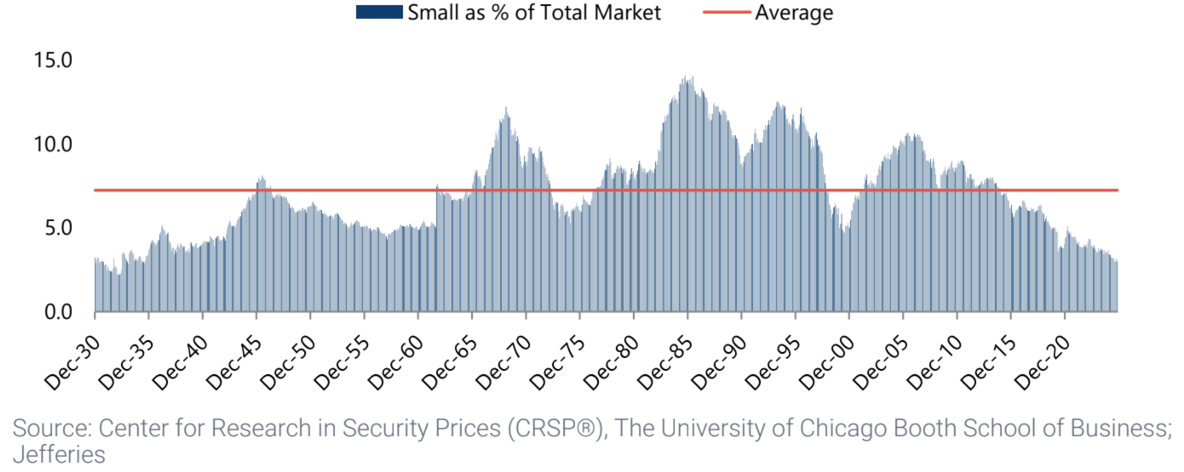
From the lows in 2000, small cap value stocks outperformed the S&P 500 by 177% and large cap growth by more than 215% over the following six years. Also, small caps today are below 3% of the total equity market, well below the 2000 trough. One would need to go back to the 1930s to find a time period where small caps were such a small portion of the marketplace.
Investors remain under-allocated to small cap value stocks at a point of time that has historically led to attractive forward 10-year returns. With the top five U.S. equities more than 5x the entire Russell 2000 market cap, a small reallocation could have a very positive impact on small cap returns.
Looking at the recent Magnificent 7 outperformance cycle, the above market returns have been driven by strong earnings growth and valuation expansion. Some similar drivers could emerge for for small caps in 2026 and beyond. With the valuation spread between large cap growth and small cap value near historical extremes, we believe we are still in the early innings of what could be an attractive small cap value outperformance cycle!
Deep Value Select Strategy Highlights
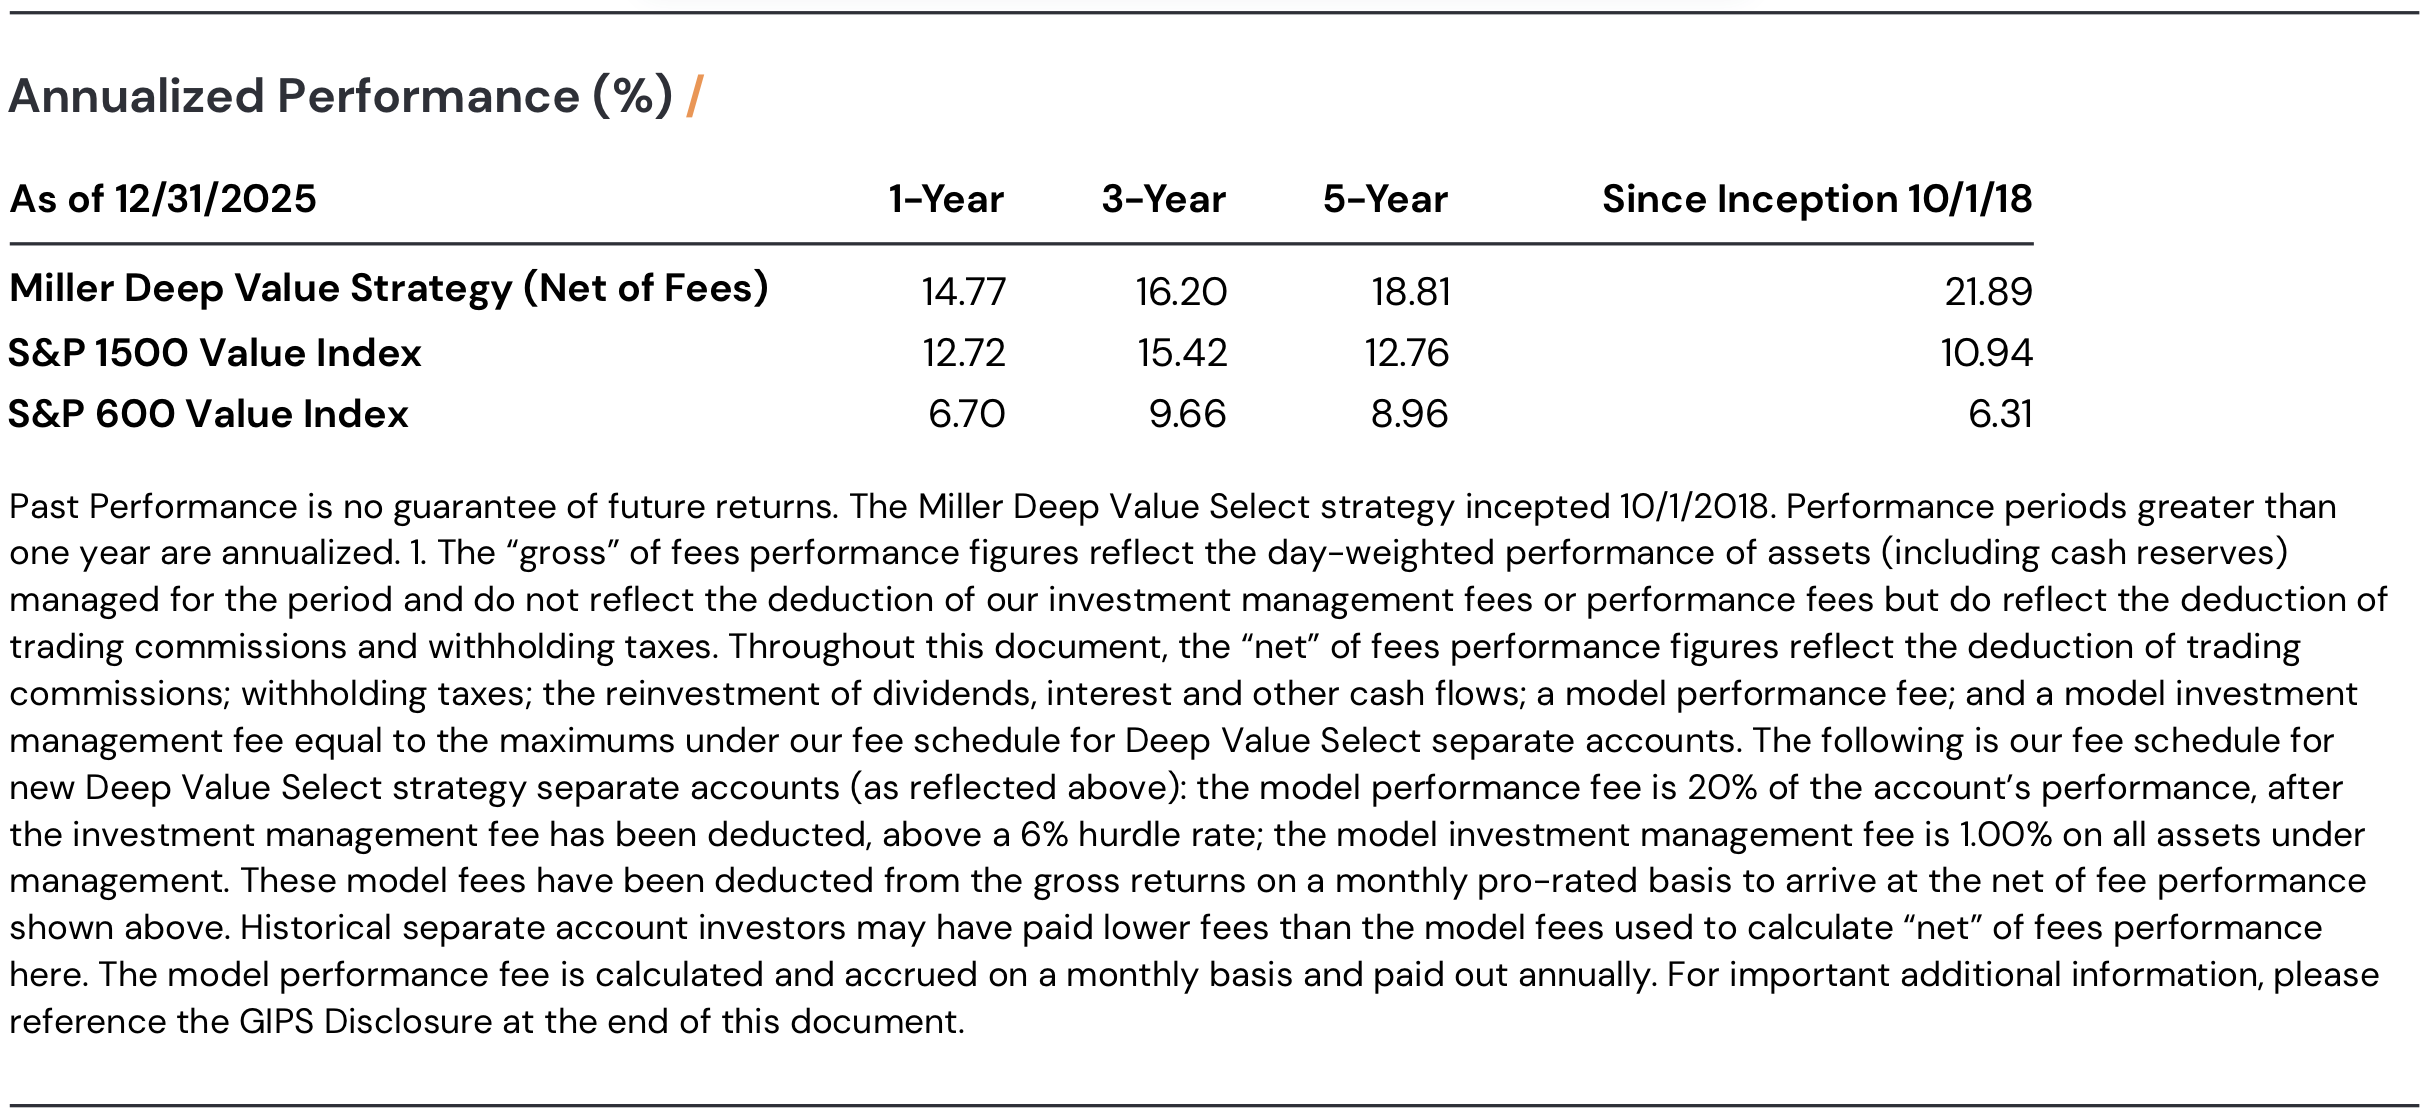
During the quarter, the Deep Value Select strategy returned +5.09%, versus the S&P 1500 Value Index at +3.15% and the S&P 600 Value Index at +3.42%. For 2025, Deep Value Select Strategy net returns are +14.77%, ahead of the S&P 1500 Value Index at +12.72% and ahead of the S&P 600 Value Index at +6.70%. This was the seventh consecutive year of positive returns for the strategy. Since inception, the strategy has annualized net returns of 21.89%, versus 10.94% for the S&P 1500 Value Index and 6.31% for the S&P 600 Value Index.
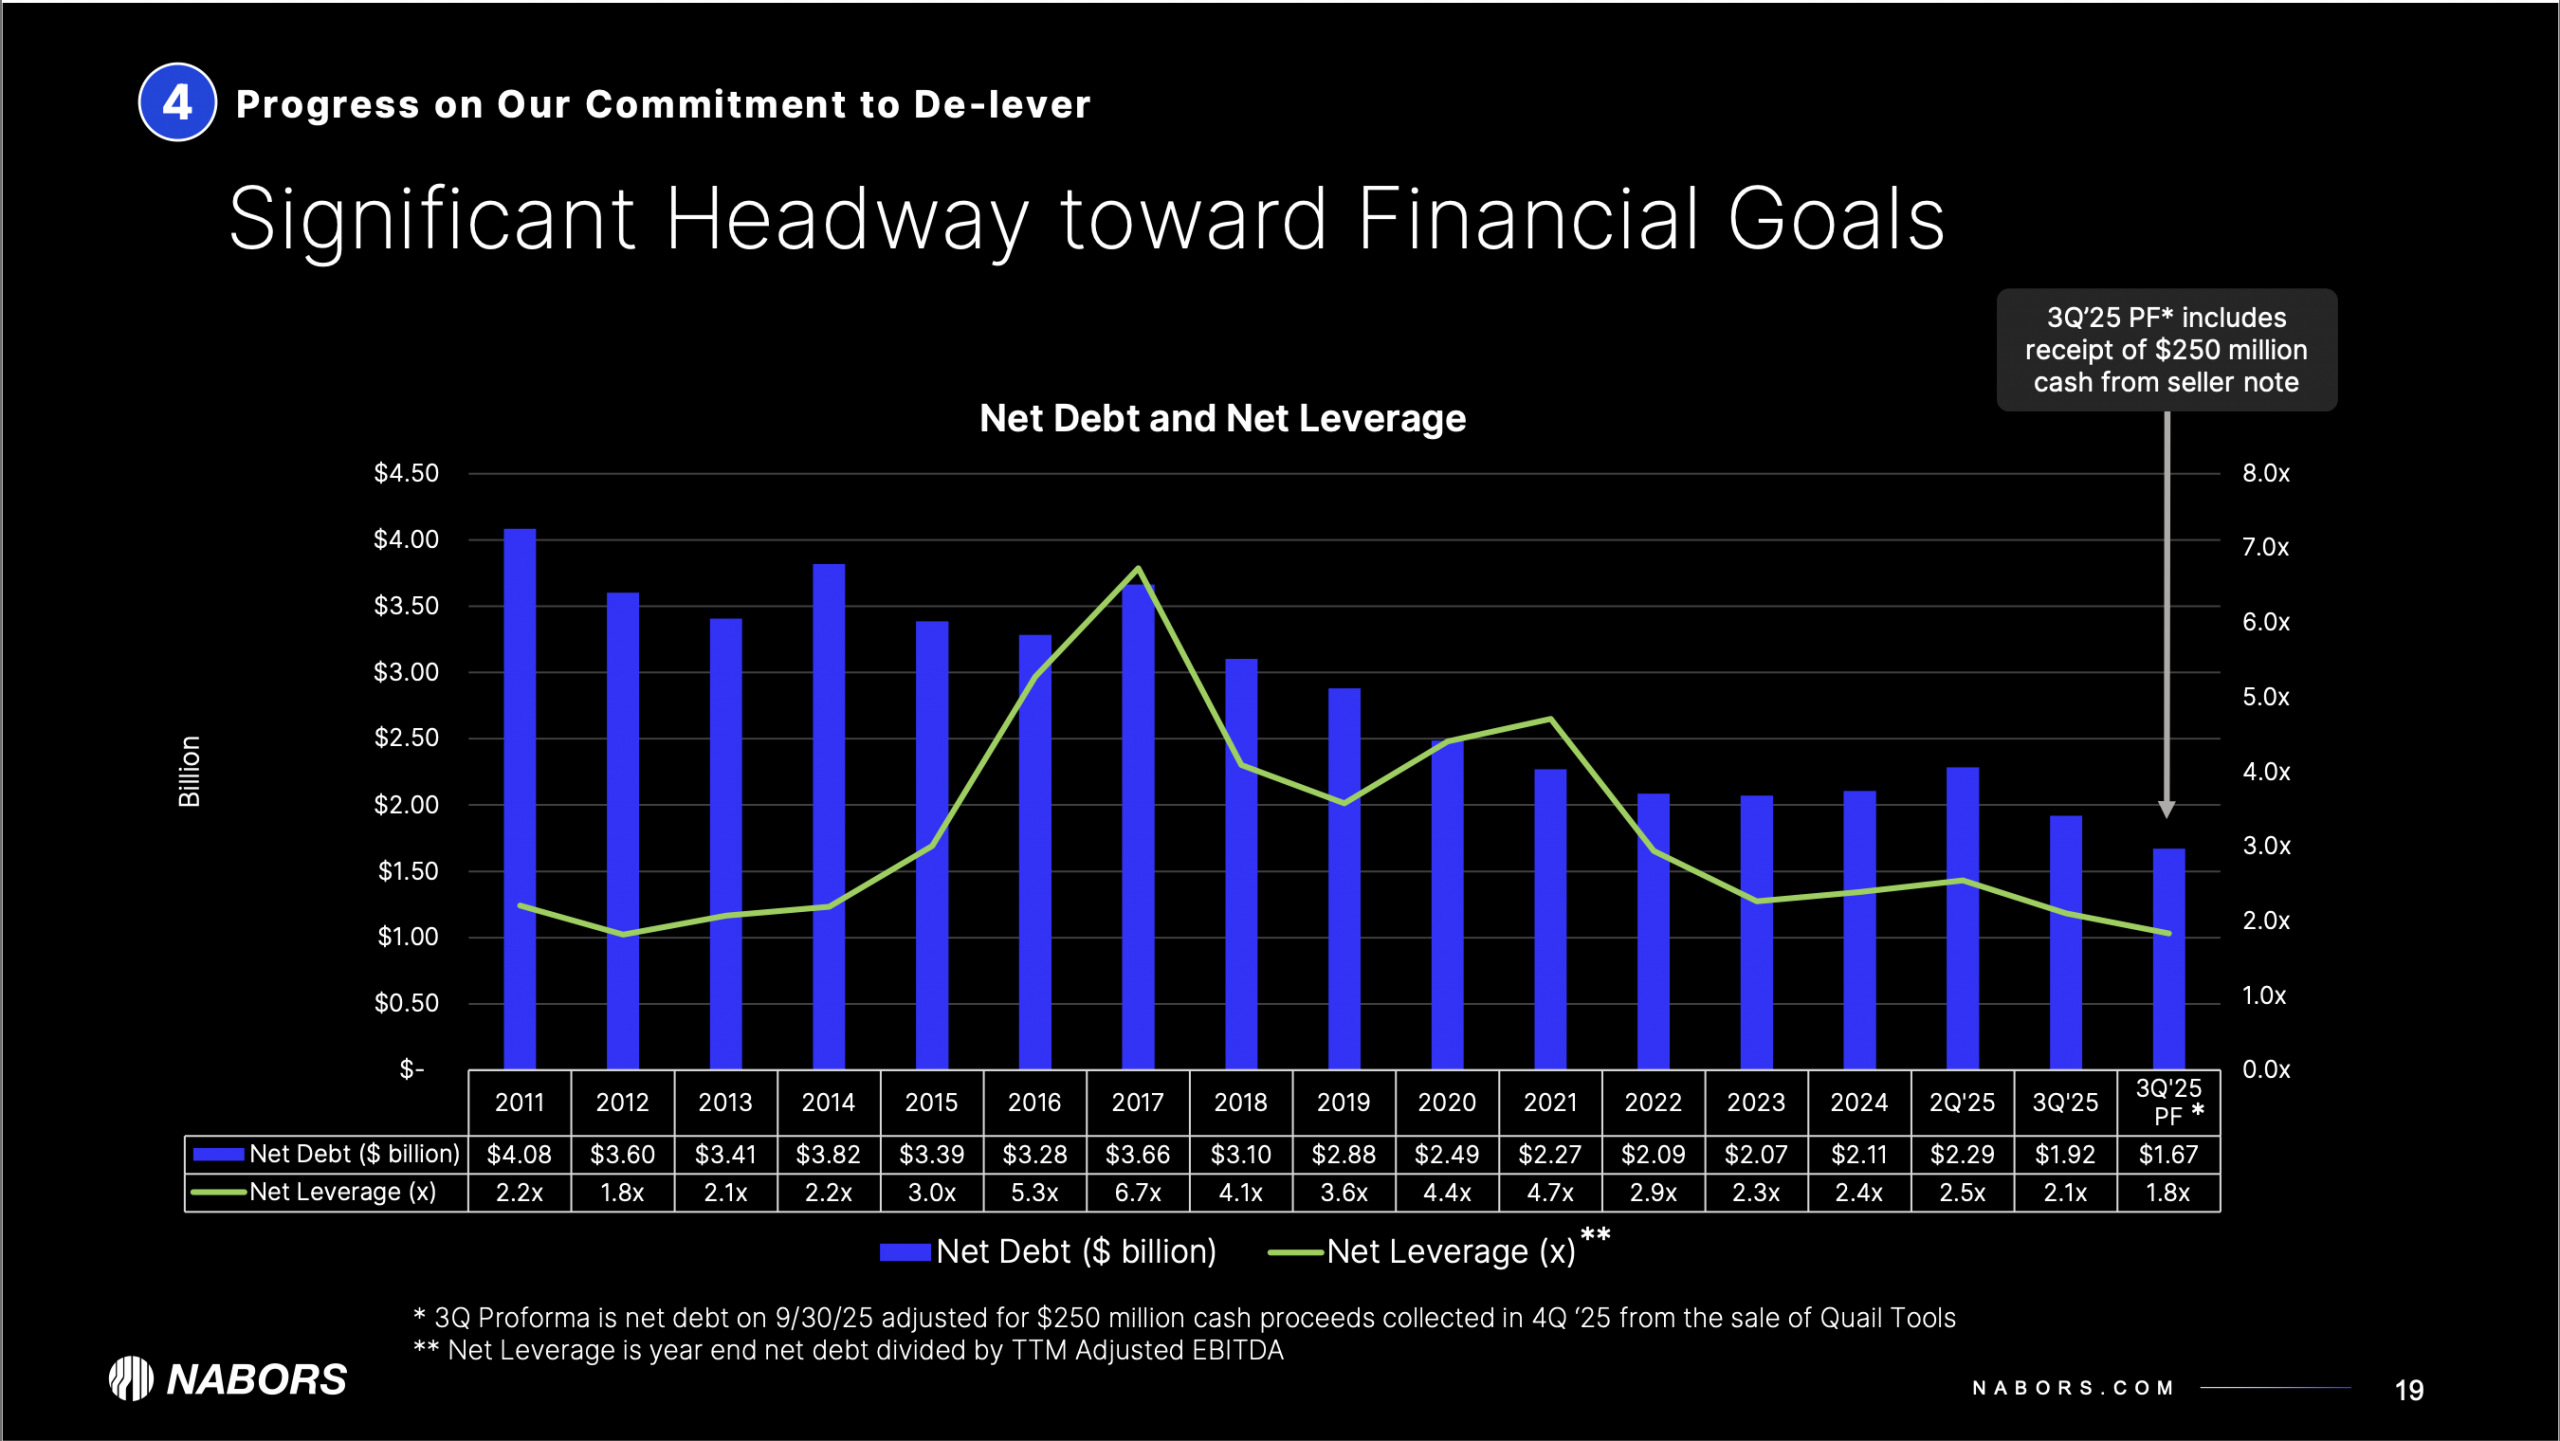
During the quarter, the largest positive contributor was Nabors Industries (NBR), which was up 33%. Nabors successfully completed the sale of their Quail Tools business segment which significantly improves the company balance sheet. Ten years ago, Nabors was over levered, with debt leverage greater than 6x. As the chart below highlights, net debt is down significantly, and debt leverage ended the quarter near 2x. With the remaining sales proceeds coming in after quarter end the company expects to end the year under 2x debt leverage. Management is in a good position to eliminate all debt maturities before 2029. Nabors’s debt holders appreciate the balance sheet improvement, with 2030-31 debt maturities now trading above par.
However, equity sell-side analysts continue to cite excessive debt leverage, providing investors with a nice ongoing variant. Nabors looks well positioned to benefit from any pick-up this year in global rig demand, ongoing expansion of their low capital-intensive drilling solutions and scaling their 50-rig program with SANAD. Management achieving 2025 guidance and ongoing debt reduction could support Enterprise Value to EBITDA (forward 1-year) below 3x, near an all-time low and a significant discount to Nabors 15-year average of 5.9x. While oil prices falling towards $50/barrel is a potential risk, we believe this marketplace fear is well known and significantly discounted in Nabors current share price today. Nabors long-term upside potential is still meaningfully above the current share price with the shares currently trading near 1x cash flow and greater than 50% normalized free cash flow yield.
Our two largest detractors during the quarter were JELD-WEN (JELD) and Conduent (CNDT), down 48% and 31% during the quarter, respectively. Both companies’ share prices are at deep discounts to what we believe is their long-term fundamental value, and we increased position sizes in both holdings during the quarter.
JELD-WEN, is a leading North American and European manufacturer and distributor of interior and exterior doors and windows, undertaking a multi-year transformation. Their plan has similarities to Masonite’s successful transformation ten years ago. Masonite was able to improve EBITDA margins from single digits to 20% before being sold to Owens Corning at 8.6x EV/EBITDA. JELD-WEN share price has recently been under pressure due to multi-year year trough in housing and a challenging repair and remodel market. While the prolonged housing trough could remain a near-term headwind, JELD-WEN is undertaking a significant cost reduction program to offset revenue challenges to restore profitability overtime. The company has extensive asset base (e.g., owned real estate) which could also provide asset monetization potential to accelerate the transformation plan and unlock equity value. In addition, the Administration appears prepared to take actions to improve housing affordability which could accelerate a housing recovery. JELD-WEN share price is near 1x normalized free cash flow yield, we believe JELD’s share price may be significantly mispriced and has upside potential above the current share price.
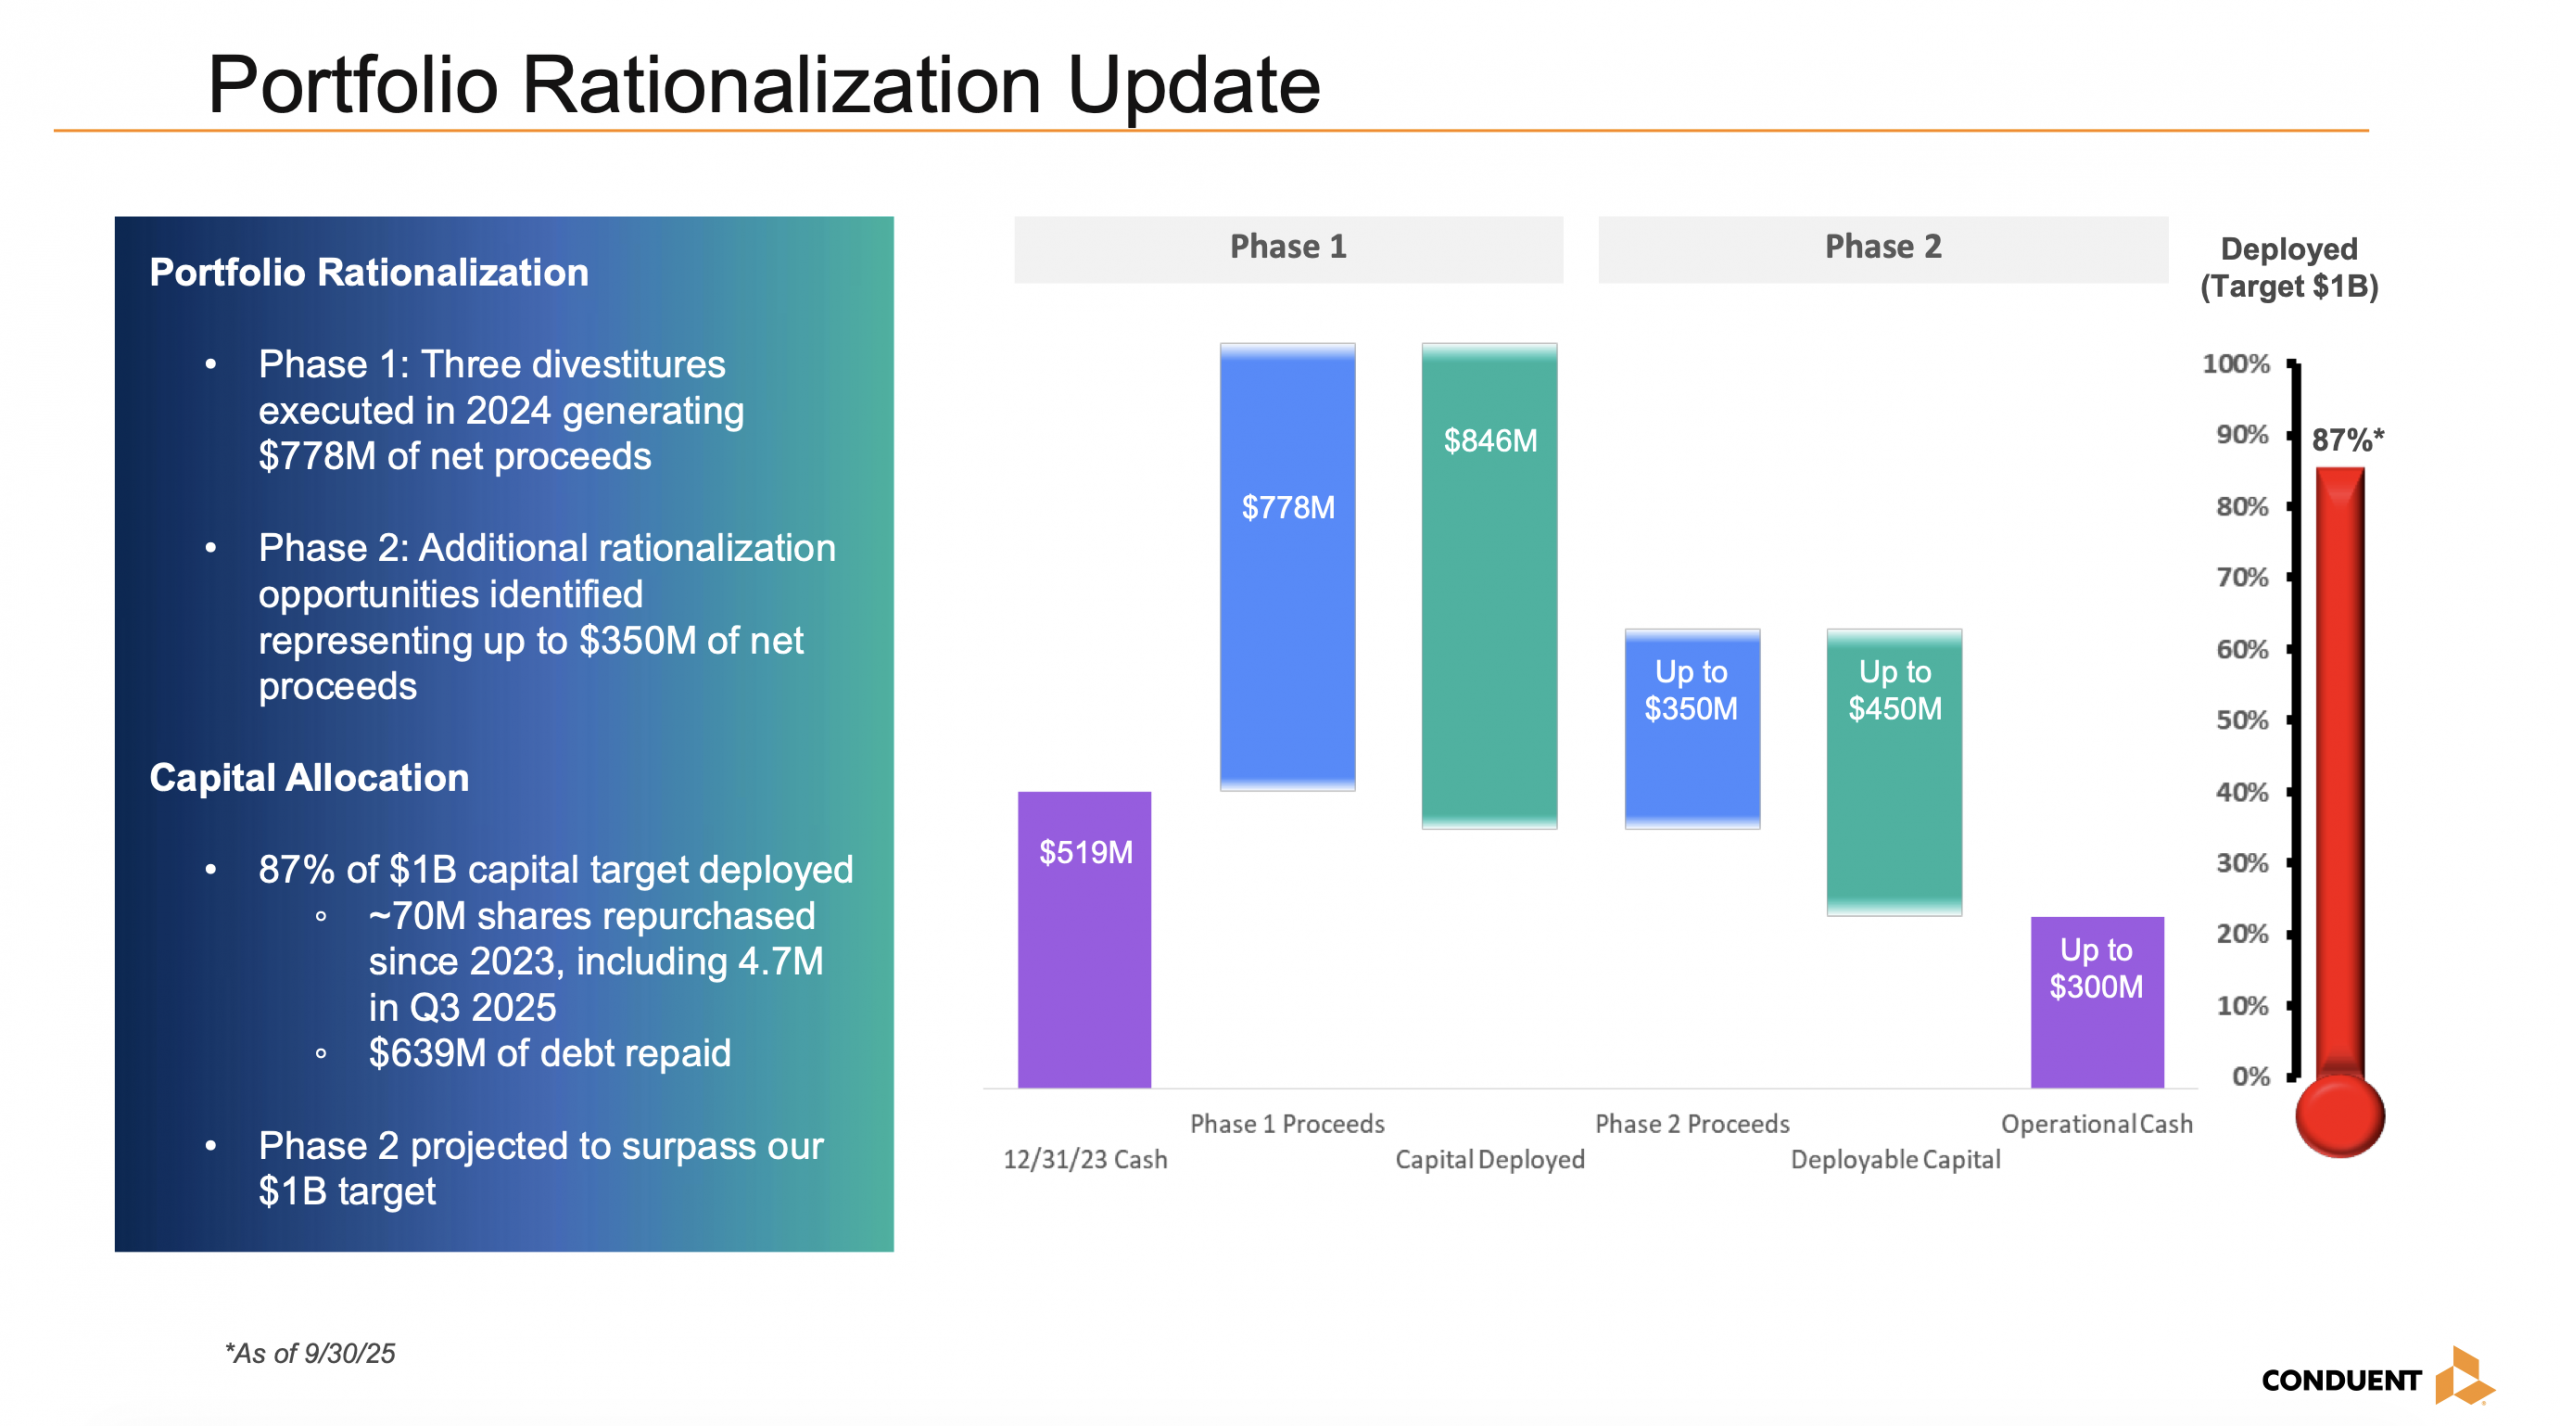
Conduent delivers digital business solutions and services to 50% of Fortune 100 clients and 46 of 50 states. New management has undertaken a multi-year transformation, streamlining the operations, increasing enterprise investments, rebuilding sales pipeline, and divesting non-core assets. Phases 1 of the portfolio rationalization generated $778M of net sales proceeds that were used to enhance the balance sheet, reducing outstanding debt through 2029 and buying back more than 30% of outstanding shares. During the upcoming year, management will focus on reducing stranded costs and completing phase 2 of the portfolio rationalization that should lead to improving margins, further debt reduction, and accretive share buybacks.
The company also has extensive patent portfolio (more than 600) that we believe is underappreciated by the marketplace. Management has integrated multiple AI initiatives to provide innovative solutions across the Business Process Services (BPS) value chain. Conduent has a sizable government business which could experience near-term disruption from additional government closings. However, we believe that current discounted share price may reflect this market fear. Conduent shares look significantly mispriced, less than 2x normalized EV/EBITDA, versus publicly traded peers at 8 to 10x.
While the market indexes remain crowded in longer duration equities, we remain disciplined, focused on identifying attractive turnaround situations, significantly mispriced cyclicals and companies going through multi-year transformations. While our holdings are micro/small caps, we see this as temporary due to a severely depressed share price, fraction of the company’s underlying asset base and business model (revenues generally $3B+). Our holdings tend to have multiple long-term performance drivers: returning to normalized earnings and free cash flow through ongoing operational improvement, non-core asset monetization, valuation expansion potential narrowing the gap to private market transactions/publicly traded peers and favorable capital allocation.
We thank our clients for their long-term partnership and remain well positioned to pursue attractive long-term returns.
Dan Lysik, CFA
January 12, 2026