
The market recovery that began in early April continued throughout the third quarter. While growth and momentum stocks remained strong, generating double-digit returns, the marketplace began to broaden out. Small and micro-cap value stocks posted their strongest quarterly returns since Q4 2023. After a four-year pause, small caps resumed their upward momentum, finally reaching a new high and breaking the price level peak of 2021. We believe we are still in the early innings of a multi-year outperformance cycle for low valuation equities and smaller market caps.
Market participants have been enamored with the longest duration equities, a sizable portion of which are Technology and AI-related companies. While it is always hard to know the exact peak in optimism, having invested through the late 1990s and early 2000s time-period we are seeing similar excessive exuberance building in that portion of the market. Crowded ownership in technology companies has led to significant ownership overlaps across investment classifications along with market valuation expansion. But, the chart below is telling about the sector’s contribution. At quarter end, the S&P 500 Technology sector weighting increased to 34.8% of the S&P 500 Index – more than 1,000 bps above the sector’s earnings contribution!
The Technology sector is quickly approaching its all-time high weighting of 34.9%, achieved on 3/27/2000 (Dot Com peak). Investor FOMO (fear of missing out) in longer duration equities is taking precedence over valuation and prudent margin of safety. However, history reminds us how marketplace views can move from excessive optimism to pessimism in short order. We saw a brief example of this during 2022 when longer duration equities saw a significant pullback. The Dot com bubble in technology stocks in the late 1990s was followed by a greater price correction from 2000 to 2002. From the highs in early 2000, the S&P 500 Technology sector weighting fell from 34.9% to 14.3% by the end of 2002 (only 21 months later).
While it is possible for Mr. Market to continue to push longer duration and technology share prices higher in the near term, we are reaching the higher end of historical levels. The Technology sector forward price-to-earnings multiple is above 30x, significantly higher than the 20-year historical average of 18.3x. Higher share prices will eventually become more vulnerable to any disappointment with elevated future market expectations.
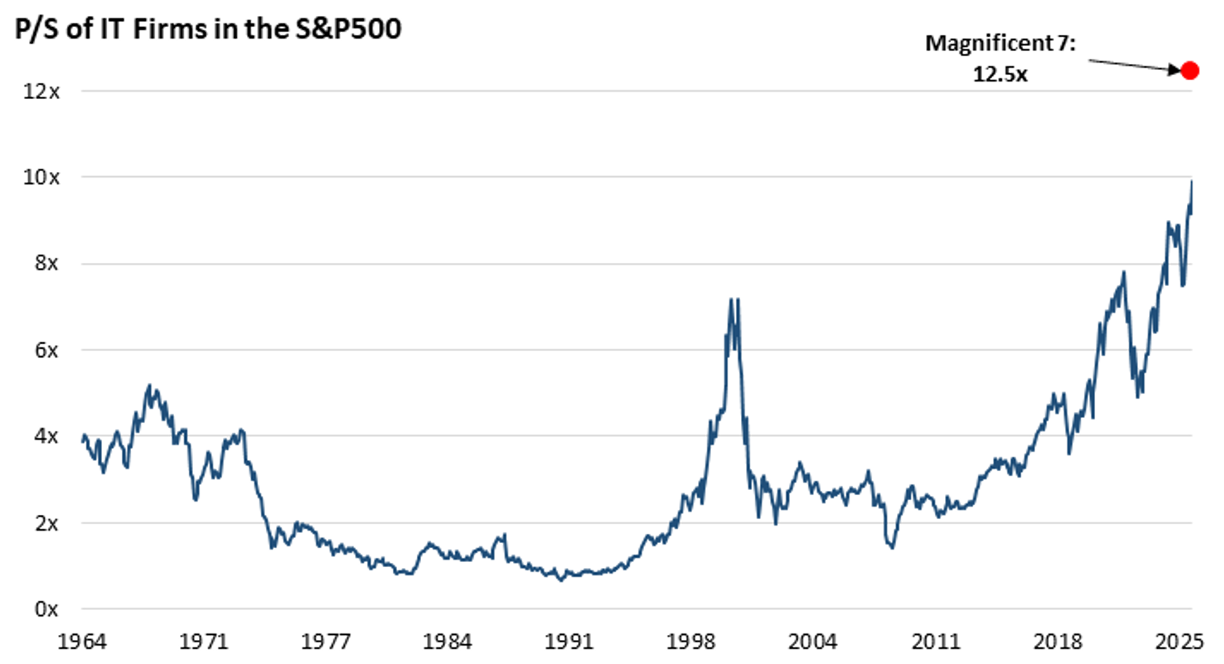
Given the Technology sector is near historically peak margins, it is important to also highlight the sector’s price to sales multiple. As the chart below highlights, it is well above the 2000 peak of 7x, approaching 10x revenue, with the Magnificent 7 approaching 13x! Long duration equities combined weighting in the S&P 500 is also at an all-time high – nearly 35% of the index weighting has a price-to-sales above 10x.
Long duration equities are also impacting investment classifications and broader passive indexes. Today, the S&P 500 Index resembles a more concentrated Growth Index. The Technology sector plus non-Tech Magnificent 7 weighting is now more than half of the S&P 500 Index, increasing passive index valuation multiples. Even the S&P 1500 Value Index is being impacted by the growing Technology representation, with a greater than 24% weighting.
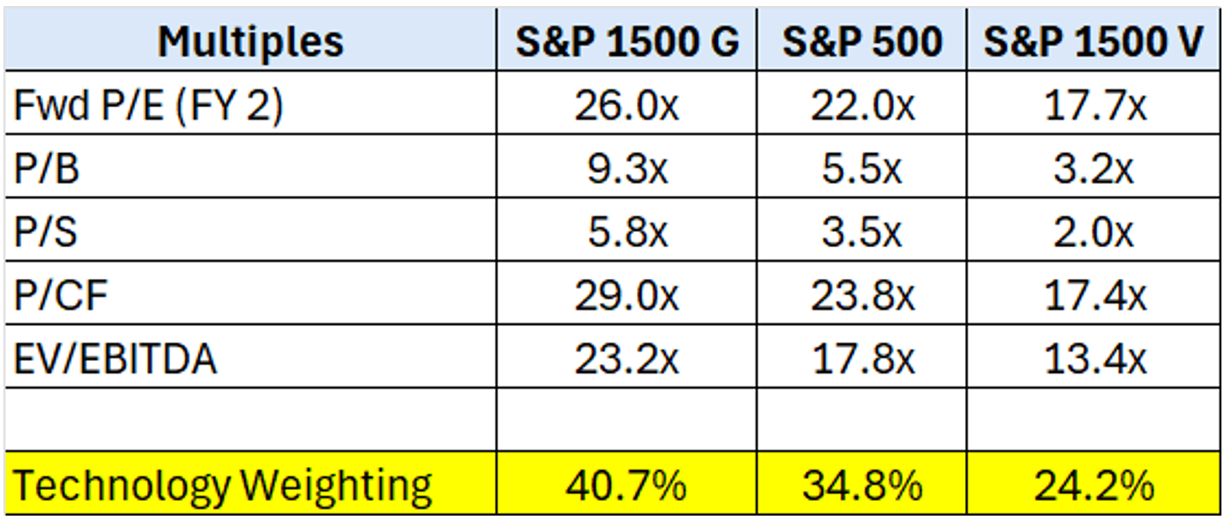
It is surprising to see that Apple and Microsoft are now the two largest holdings in the S&P 1500 Value Index. Both companies are above 30x earnings, with an earnings yield well below 10-year treasury bond yield!
However, as you move towards the lowest valuation equities and lower market cap Indexes you will notice the Technology representation falls with these more diversified Indexes (top 10 weight between 10.7% and 11.7%).
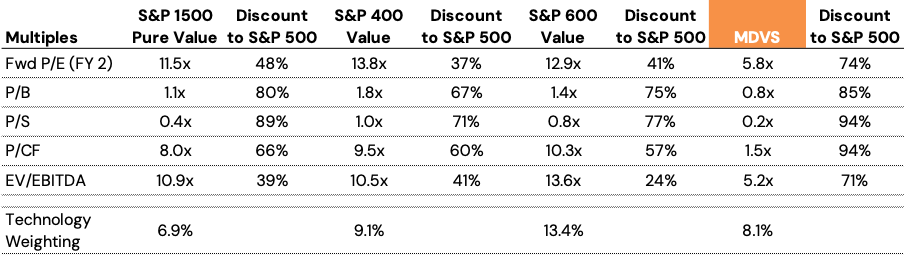
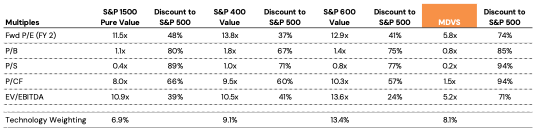
Valuation measures of these subsets of the market are at a significant discount to the S&P 500 Index. There are very wide valuation spreads between low valuation and longer duration/technology equities today. We also highlight Deep Value Select strategy’s valuation multiples at greater than a 70% discount to the S&P 500 Index. There are extremely attractive valued equities still in the marketplace with low market expectations and attractive asymmetric return potential!
During the 2020 Covid outbreak, growth and momentum stocks were the early leaders in the market recovery. Technology companies saw a boost in revenue growth from incremental demand and surge in technology sector capital spending. As time went on, smaller companies and low valuation securities took over market leadership, due to accelerating earnings growth and narrowing wide valuation spreads. We see the possibility of a similar environment playing out over the coming year.
The small cap sector is emerging from a multi-year earnings recession. Future interest rate cuts, ongoing deregulation and expected $150M of incremental tax savings in early spring from the recent tax bill provides additional tailwinds to smaller company profitability. During 2026, small cap earnings growth is expected to be ahead of larger companies. Year-to-date, larger companies’ earnings have seen benefits from incremental inventory build as companies looked to get ahead of higher tariffs.
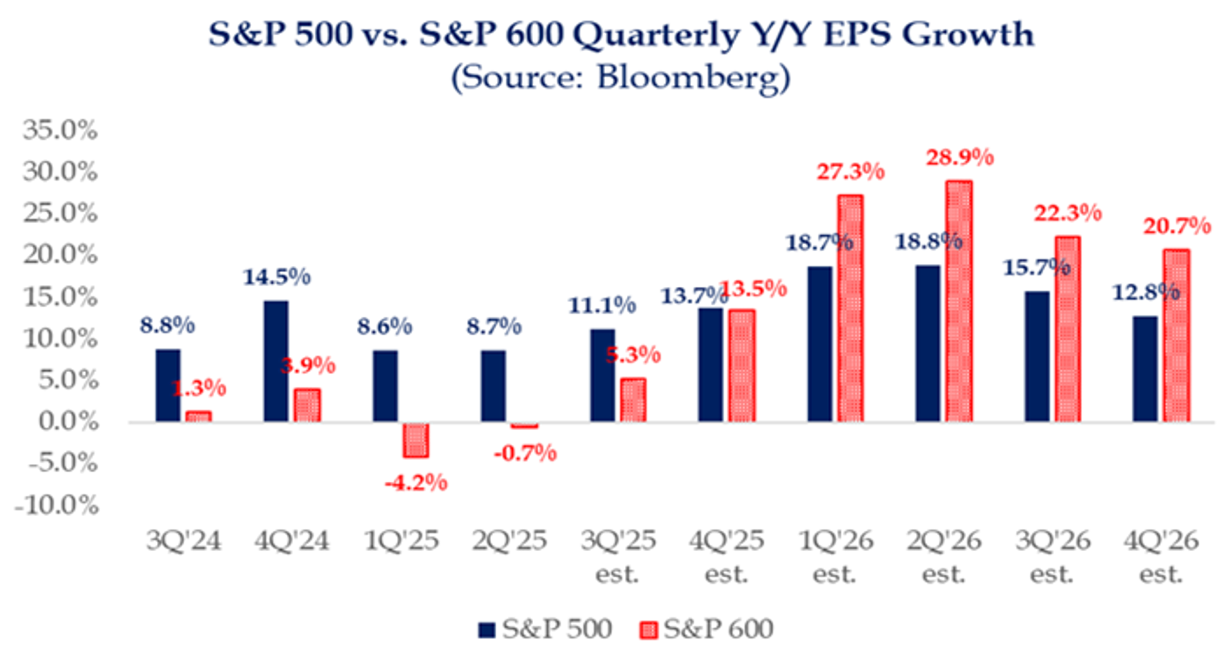
We believe this may create some more challenging comparisons and margin pressures over the coming year. While the marketplace is focused on Technology and AI companies, smaller companies may end up being the biggest long-term beneficiaries from utilizing AI and other technological advancements to enhance their business’ productivity and profitability over the coming years.
We believe low valuation and smaller market cap equities are being overlooked and are a very timely opportunity today!
Miller Deep Value Strategy Highlights
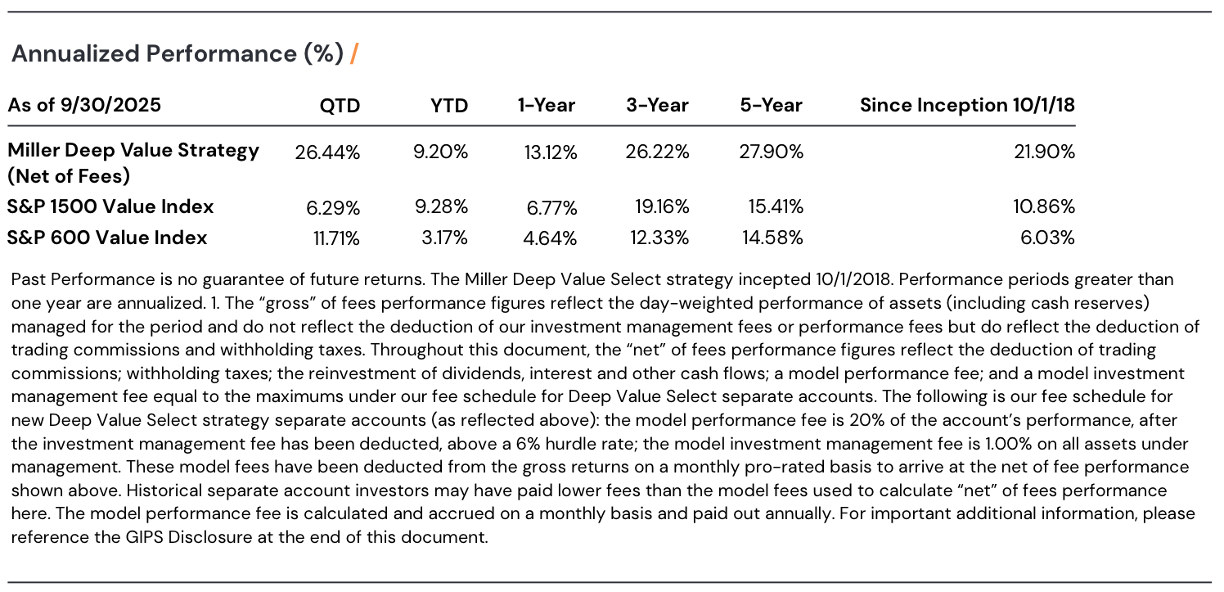
During the quarter, the Deep Value Select strategy was +26.50%, versus the S&P 1500 Value Index +6.29% and the S&P 600 Value Index at +11.71%. Year-to-date, Deep Value Select Strategy net returns are +9.20%, slightly behind the S&P 1500 Value Index at +9.28% and ahead of the S&P 600 Value Index at +3.17%. The broadening of the market during the quarter was a tailwind for strategy performance. We continue to see significant embedded value in our holdings as their current valuation is a large discount versus industry peers and private market transactions.
During the quarter, ten of our twelve holdings delivered positive double-digit returns. The largest positive contributor was Nabors Industries (NBR), whose market share price was up 46%. Nabors Industries has undertaken a multi-year transformation focused on leveraging their industry’s leading technology. The company has over 450 patents, and has developed industry leading drilling automation/robotics, Rig Cloud platform and smart apps, rolling out globally, not only on Nabors rigs but also on third party rigs. During the quarter, Nabors sold their Quail Tools business segment for $600M. Sale proceeds will be used to accelerate debt reduction, enhancing the company balance sheet and liquidity.
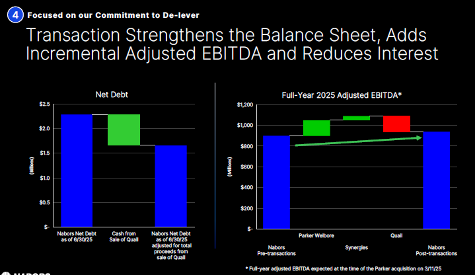
Management achieving 2025 guidance and ongoing debt reduction would lead to Enterprise Value to EBITDA (forward 1-year) approaching 2.5x, an all-time low and a significant discount to Nabors 15-year average of 5.9x.
Nabors share price looks extremely attractive, at less than one times forward cash flow – the only other period it has traded at a lower ratio was a brief time during the Covid 2020 outbreak. Current marketplace fears appear due to falling commodity prices, and expectations for additional rig cancellations. While oil prices falling towards $50/barrel is a potential risk, we believe this marketplace fear is well known and significantly discounted in Nabors current share price today. We believe Nabors long-term normalized EBITDA could be closer to $1.5B, and the company has debt reduction potential of $1B+ over the next five years. Nabors long-term upside potential is multiples of the current share price with the shares currently trading at greater than 50% normalized free cash flow yield.
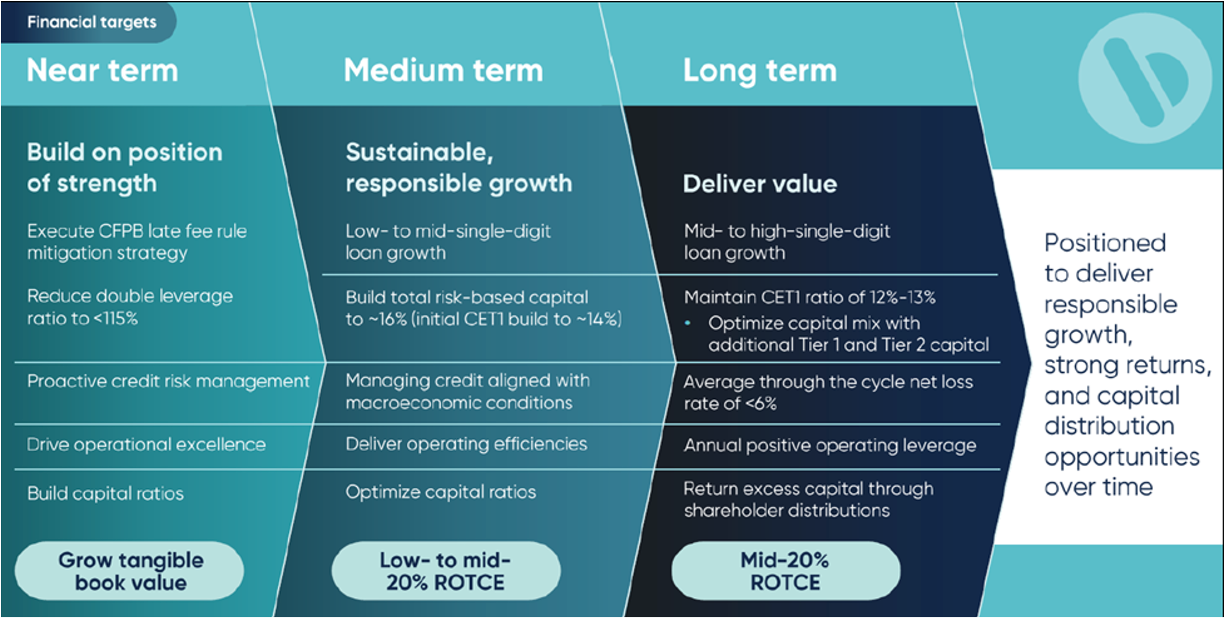
Our only negative holding during the quarter was Bread Financial (BFH), with a market share price down 2%. The company provides proprietary direct-to-consumer credit cards and deposits along with digitally enabled private-label, co-branded credit cards, installment loans and buy now, pay later (“BNPL”). New management has completed a multi-year transformation to streamline its business model, enhance their underwriting process, develop differentiated products, and expand brand partnerships. An experienced and capable CFO joined couple years ago and has further enhanced the balance sheet and transformation plan. Since, the beginning of the transformation plan in early 2020, capital ratios have improved by more than 3x, debt reduced by $2B and increased direct to consumer deposits by more than $6B. Marketplace recent concerns on weaker industry credit card data appear over discounted in the current share price, as Bread management enhanced their underwriting over the past couple of years and increased their credit reserves to 13%. With company delinquency rates at half of reserve levels we see the potential for the company to see a significant reserve release over the next couple of years. Management looks well positioned to transition to their long-term financial targets, which would support normalized ROTCE in the Mid-20% and normalized earnings above $15 per share. BFH shares remain attractive in our view, trading at more than 25% normalized earnings yield.
Deep Value Select recently reached its 7th anniversary, generating close to 22% annual returns since inception. The strategy has significantly outperformed the overall market even with weaker small cap market returns. Historical holdings have generated nearly 80% of our performance since 2018, as we have recycled capital from mostly successful historical investments into new investments or increased holdings that have lagged the strategy’s historical returns. Our holdings have sizable revenue (>$3B) and asset bases and a temporary small/micro-cap market cap. Our concentrated turnaround/transformation situations all show multiple long-term value drivers (margin improvement, returning to normalized earnings/free cash flow, non-core asset monetization, capital allocation and/or valuation expansion potential) to unlock significant equity value overtime. Any improvement in small cap returns has the potential to provide incremental tail wind to strategy long-term returns.
We thank our clients for their long-term partnership and remain excited about our potential to deliver attractive long-term returns.