
Underperformance as a Prerequisite for Outperforming Over the Long Term
The most common and predictable question we receive is, “Why is ‘X’ doing so badly,” where “X” may be a stock we own or one of our strategies. Sometimes the answer is obvious, though it often is not. Despite the question’s prevalence, it has a flawed premise – namely, that recent price fluctuations have a fundamental justification. The question almost presupposes a high degree of market efficiency in its search for an explanation of the latest price change. There is a touch of irony in this, given that the questioner is almost always a client who has hired us to actively outperform a benchmark, a task that requires a belief in market inefficiency. While we acknowledge that the market is generally quite efficient, it is important for investors to understand that pursuing above-market returns over the long term requires a tolerance for substantial underperformance over shorter time horizons.
Earlier this year, we came across a great piece on the alpha architect blog called, “Even God Would Get Fired as an Active Investor.” The idea was to see how God would perform as a long-term investor with perfect foresight. Since God knows exactly which stocks will do the best over the next five years, He buys only those that will be top-decile performers over the next five years (50 stocks in modern times), and He rebalances just once every five years. Not surprisingly, His omniscience allows him to crush the market, generating a 28.9% annualized rate of return between the end of 1926 and 2009, or triple the 9.6% annualized rate of the S&P 500.
What is surprising, though, is that perfect long-term forecasting does not eliminate massive drawdowns. The strategy had drawdowns generally comparable to the market’s, and in some cases, far larger. During its worst period of underperformance in a market pullback, God’s strategy would have lost -34.0% versus the market declining -21.5% (3/31/2000 – 3/31/2001), or 1,350 basis points of underperformance over a year.
This prompted the authors to then look at how God would have done as a hedge fund manager with a long-term perspective. Again with perfect prescience, God buys the top-decile performers ahead of time and shorts bottom-decile performers, and His annualized return jumps to 49.2%. The most interesting thing about this strategy is that His maximum drawdown is still a very significant -60.0% despite hedging. Even more interesting is that His drawdown performance deviates even more from the market than in the long-only scenario. For instance, between the end of February 2009 and August 2009, God would have been down -41.9% while the S&P 500 roared higher by 39.9%, implying 8,100 basis points of underperformance over just six months. Clearly, a substantial portion of His investors would have declared Him senile and fired Him at the end of that stretch, which would have resulted in realized losses and a huge amount of foregone outperformance.
The root of such behavior lies in a variety of hard-to-avoid human tendencies, the most salient of which is myopic loss aversion. This is the combination of investors A) feeling losses more than gains, and B) evaluating outcomes too frequently. A fabulous experiment by Richard Thaler, Amos Tversky, Daniel Kahneman and Alan Schwartz highlights this phenomenon. The team tested how myopic loss aversion affects investor behavior by looking at how decisions change with different framing of identical information. The experiment asked non-faculty members at UCLA how they wanted to invest their 401(k) retirement funds. Investors had to choose between a riskier, more volatile fund with higher expected returns, and a safer, less volatile fund with lower expected returns. The more volatile higher-return fund used a return distribution based on an index of large US stocks, while the lower-return fund used a return distribution based on a portfolio of five-year government bonds, though the investors did not know this so as to prevent any predisposed bias to either asset class. Half the investors saw a graph of the distribution of one-year returns for each fund, while the other half saw a graph of average annualized return rates over 30 years.
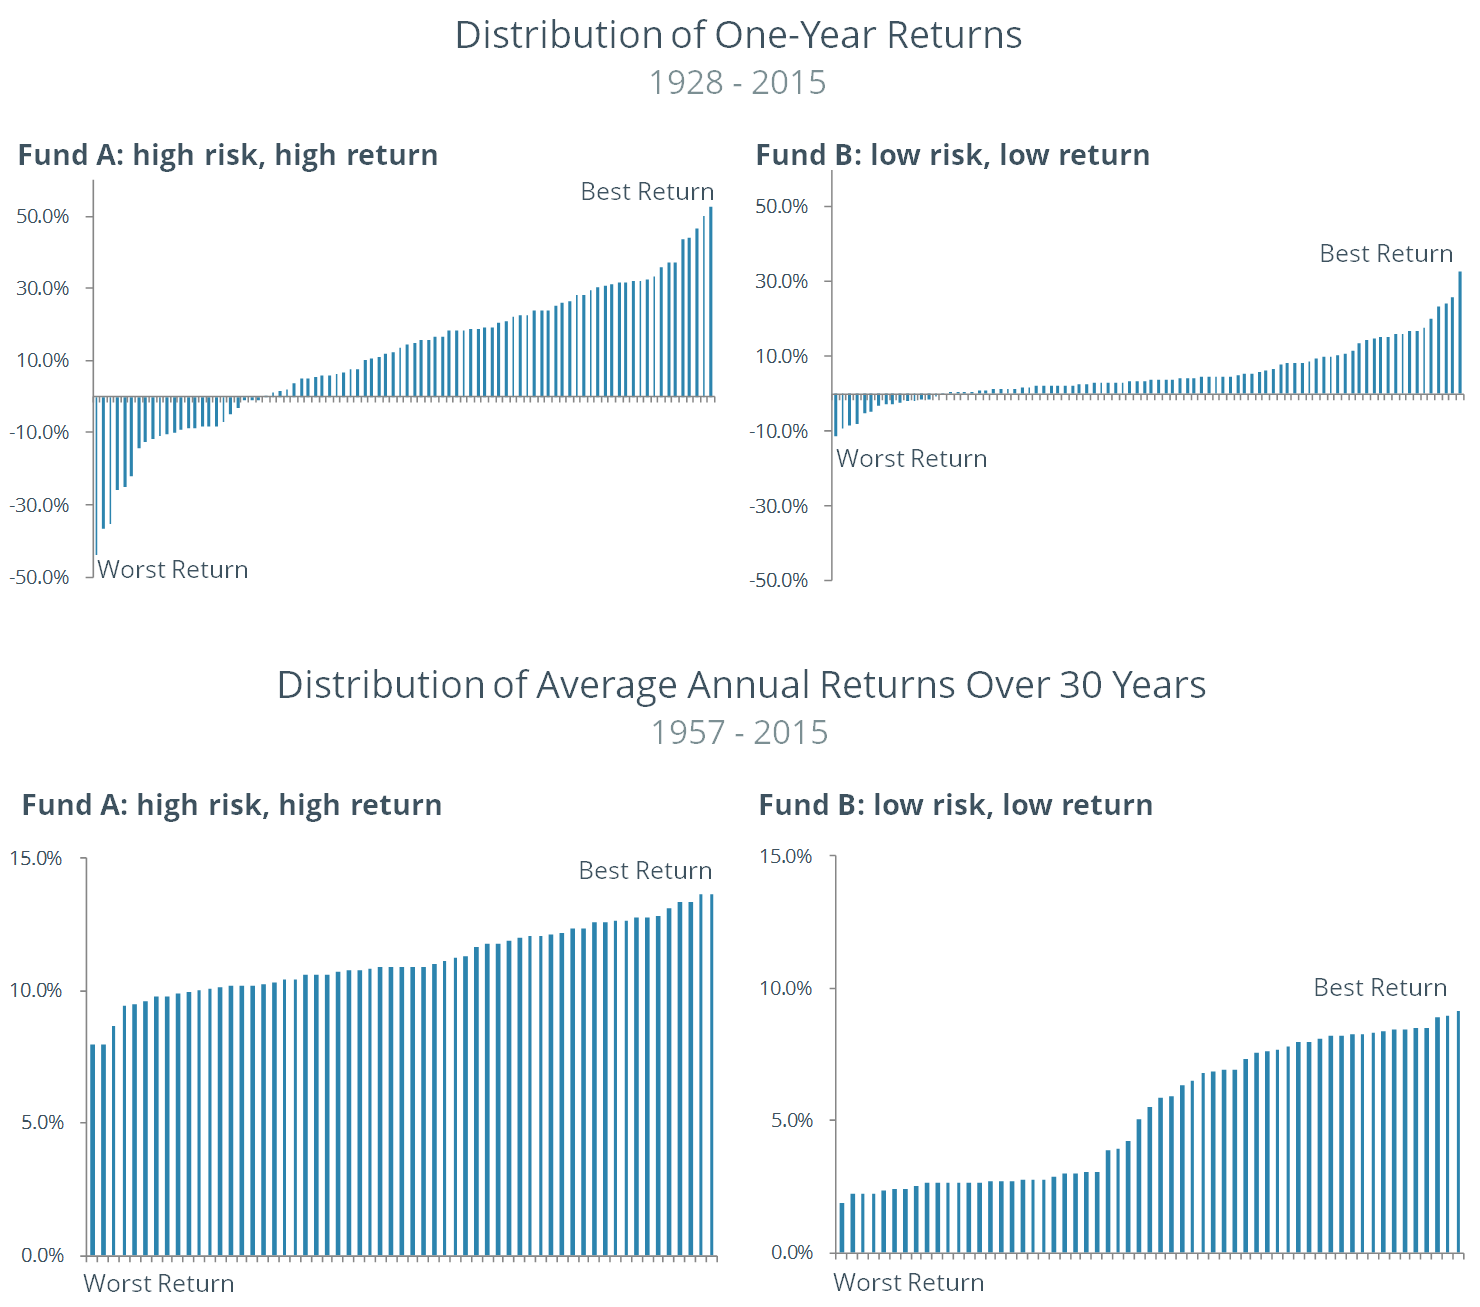
How the information was presented had a big effect on what investors did with their money. Those that saw a graph of one-year returns chose to allocate 40% of their money to stocks, while those that saw the long-term annualized returns chose to put 90% of their money in stocks.
The implication of both of these experiments is that investors would benefit from less frequent performance analysis than is at their disposal. Investors should put a much stronger emphasis on long-term performance and process than on recent returns when making hire/fire decisions. In our experience, capital allocators tend to hire managers with good recent performance and fire those with the worst performance, which is often the exact wrong thing to do. It would be a good practice for those same allocators to evaluate how the hired managers have performed in relation to the fired managers five years later. Just remember – even godly returns come with significant periods of underperformance.