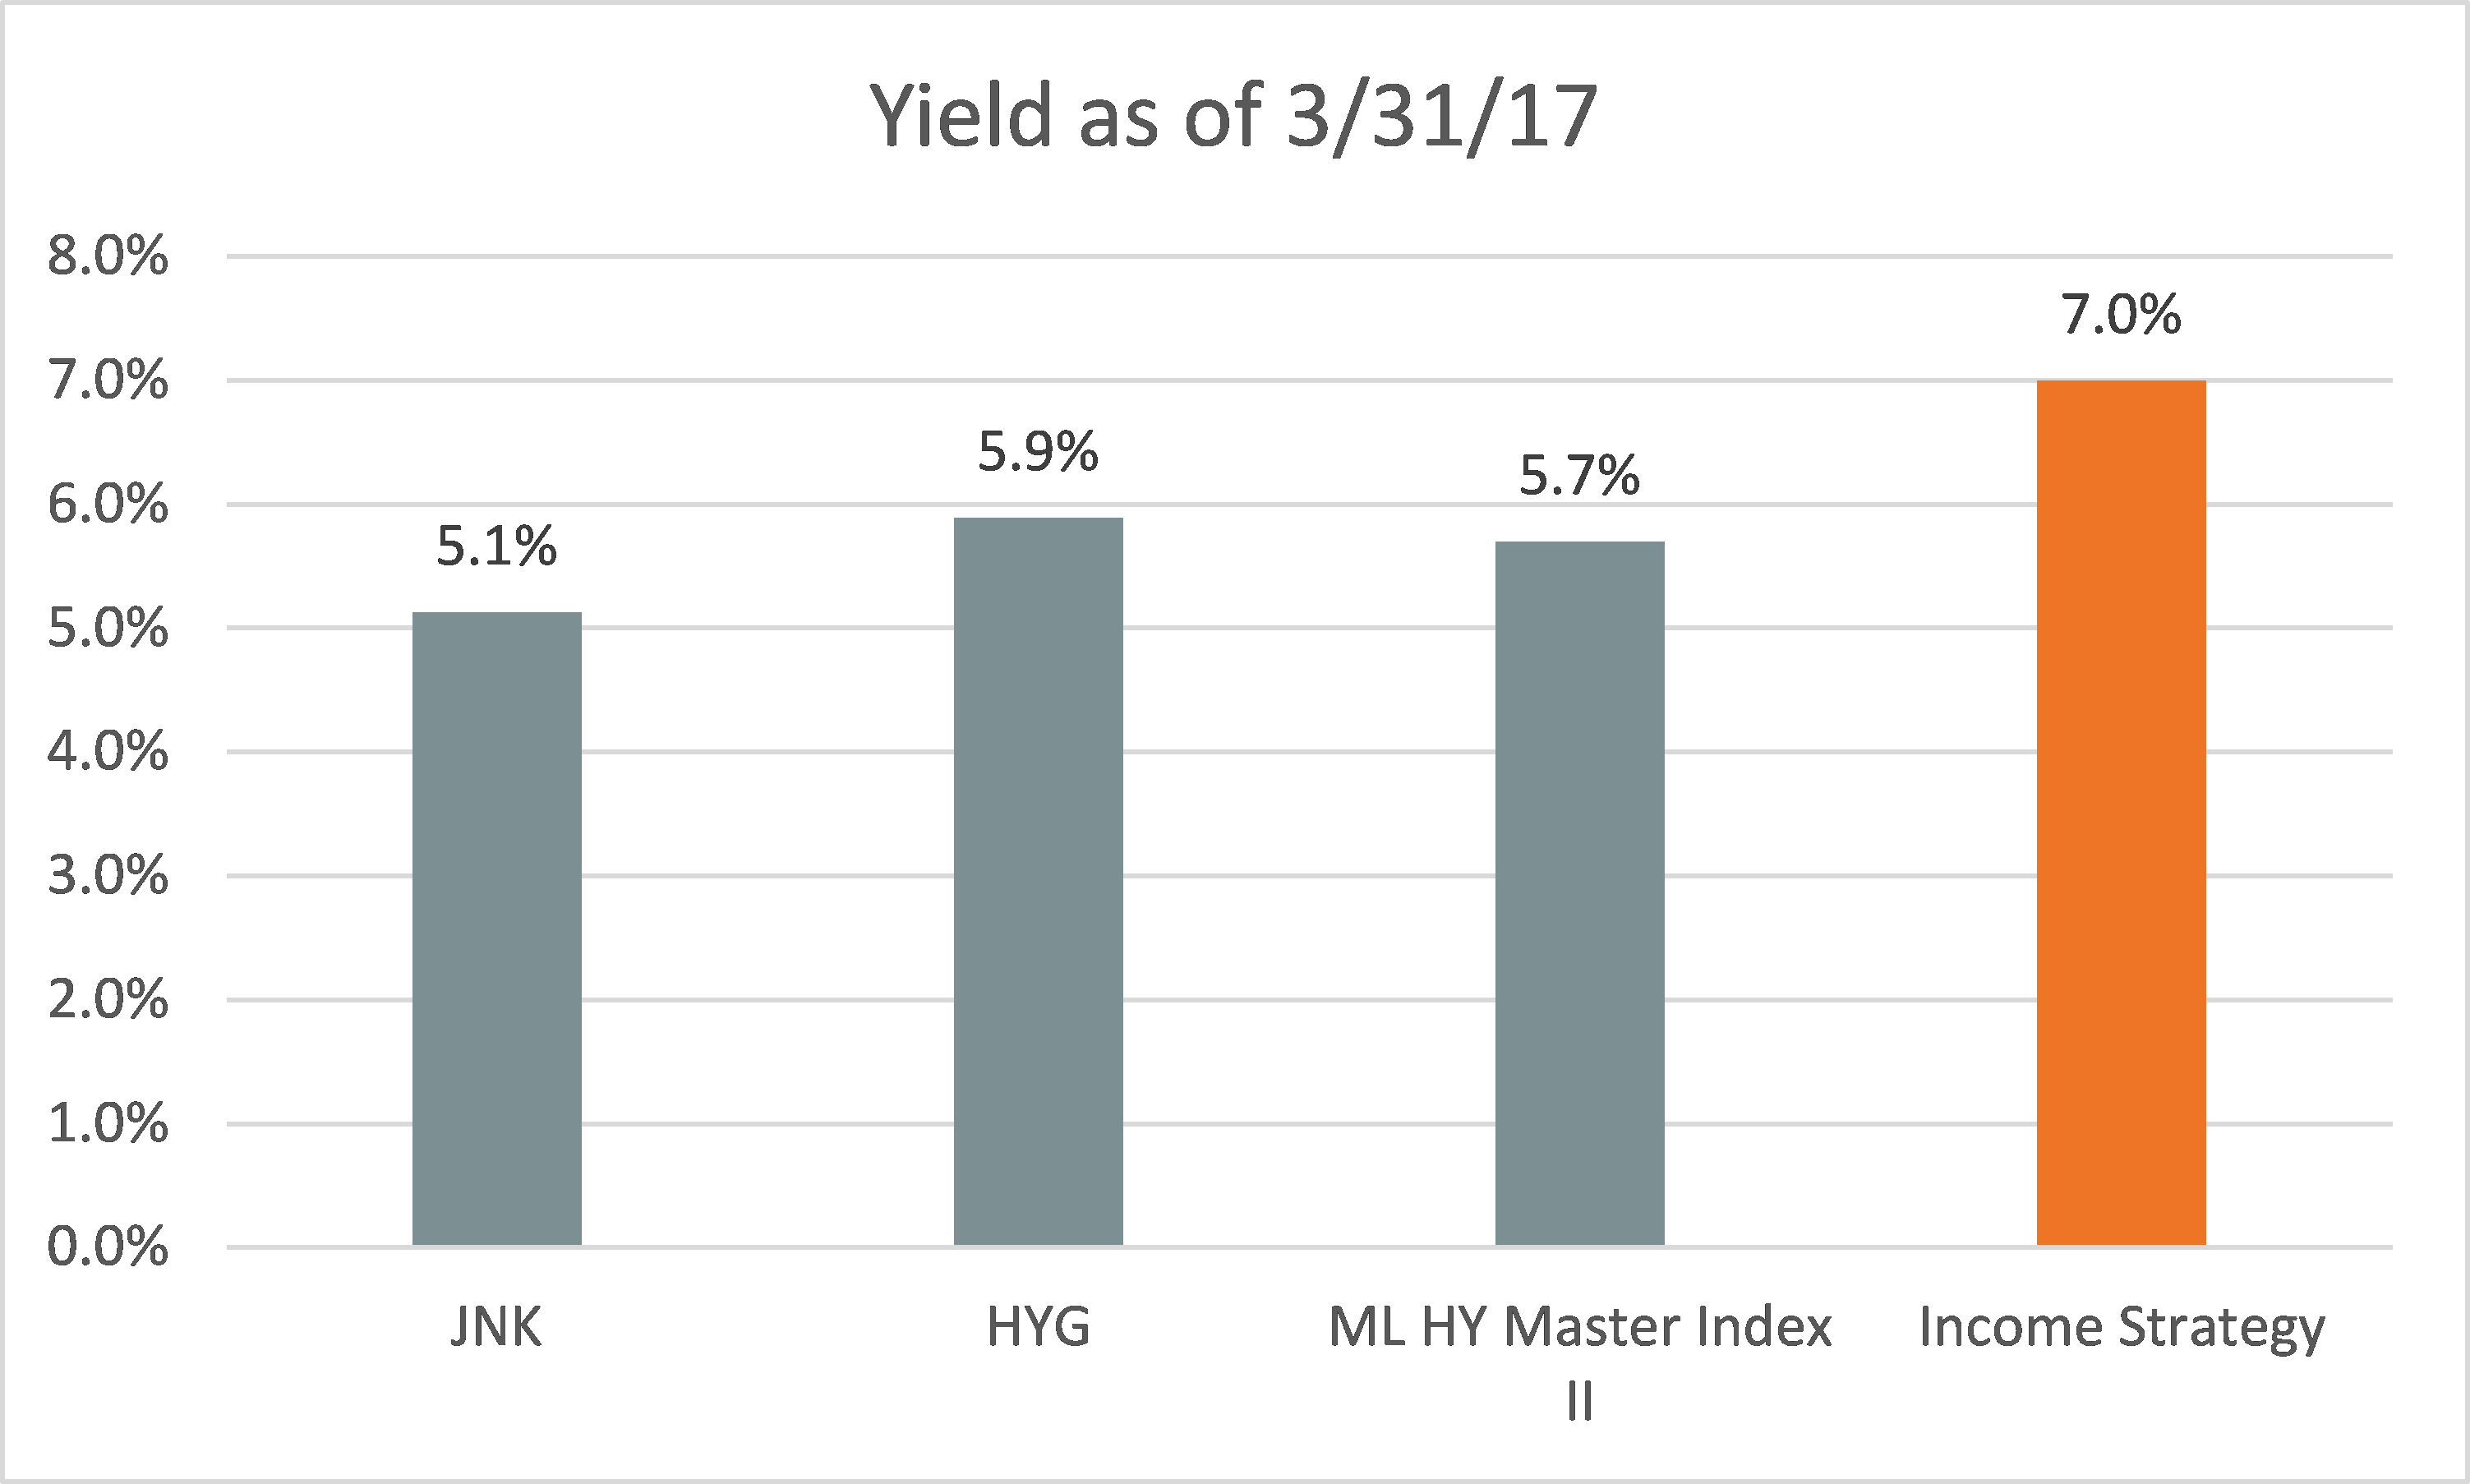
Diversified high-yield bonds may look like an enticing, low-cost way to boost an investor’s income, as the two largest high-yield bond ETFs show 12-month yields of 5.13% (HYG) and 5.89% (JNK).1

However, the fundamentals behind the yields tell a less compelling story. An objective, top-down assessment suggests investors are likely to earn minimal, if any, real return in these vehicles:
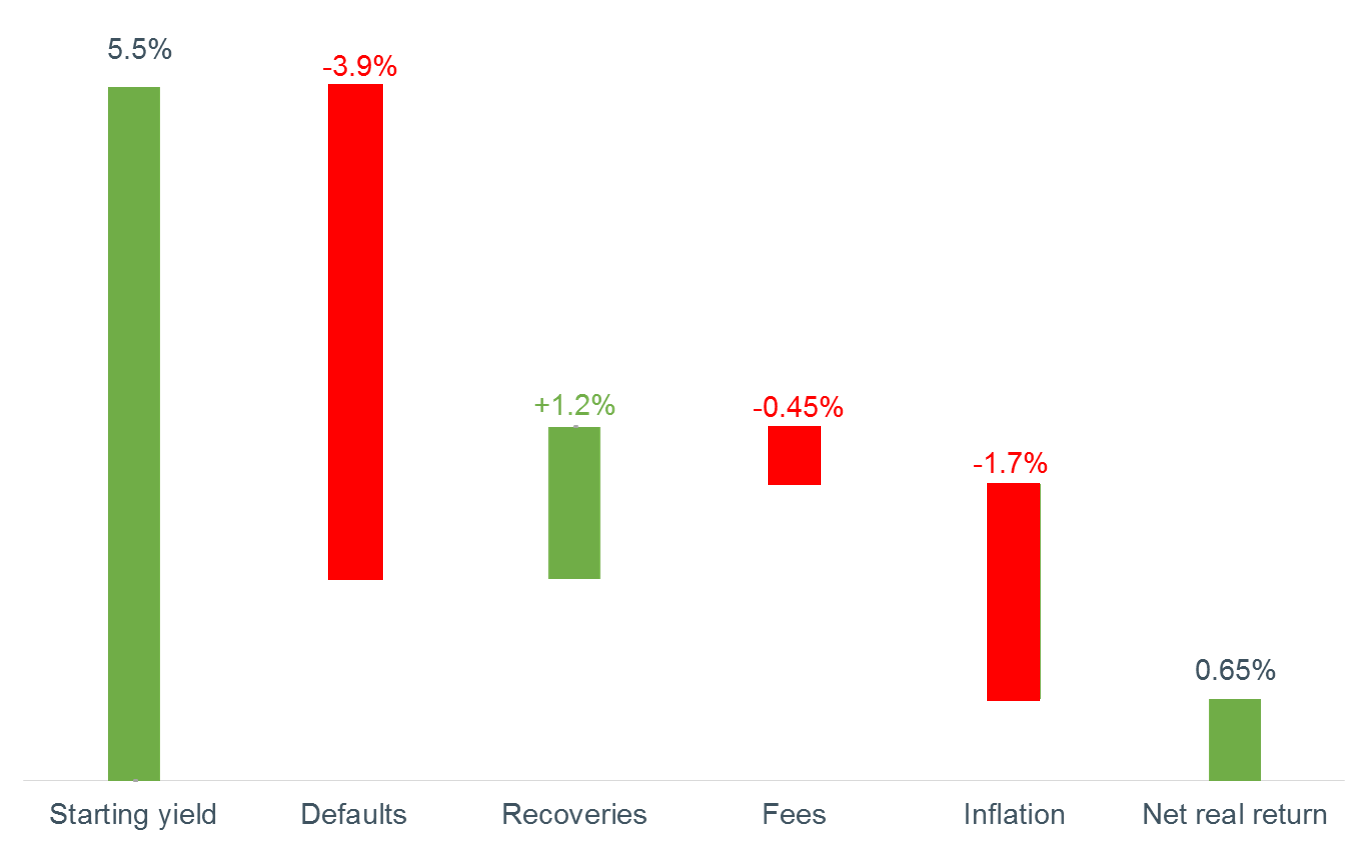
Starting Yield – Defaults + Default Recoveries – Fees – Inflation = Net Real Return

- Starting Yield: The BofA Merrill Lynch High Yield Master II Index trades at a 5.5% yield-to-worst2, which is the lowest potential yield that can be received on a bond before default.
- Defaults: According to Fitch, the default rate over the past 12 months for high-yield fixed income assets is 3.9%.
- Recoveries: The historical recovery on high yield defaults is between 30% and 40%. Moody’s reported a recovery rate of 31.3% for all of 2016.
- Fees: We used the average fee of 0.45% for HYG and JNK.
- Inflation: 1.7%2, which is a market-implied projected inflation rate over the next five years, which is derived from the nominal bond rate minus TIPS.
While there is a chance that investors will outperform a 0.7% real rate of return in diversified high yield, the base-rate fundamentals do not paint a rosy picture. Investors will need to hope for lower defaults or higher recoveries than history would suggest. Lower-than-expected inflation could improve the net return, but it could also lead to deflationary fears and widening credit spreads that could weigh on the space even worse.
