
Deep Value Strategy 3Q 2022 Letter
Market volatility continued in the third quarter as inflation exceeded market expectations and continues to remain at very elevated levels. The record fiscal stimulus following the Covid outbreak and the Federal Reserve’s excessive easy monetary policy has resulted in inflation persisting well above historical levels. Ongoing inflation pressures are the result of the war in Europe, supply shortages, rising wage pressures, strong demand for services due to reopening parts of the economy, and elevated shelter costs. The Federal Reserve continues to aggressively raise interest rates to reach the goal of lowering inflation to their 2% long-term target. With interest rates changes affecting the economy approximately 6 months out, the ongoing aggressive tightening path creates greater risk of future adverse events impacting the economy and markets. However, while recession and inflation fears remain extremely high on a global basis, there are early signs of lower inflation levels on the horizon and the U.S. economy appears to be in a better position to deal with these challenges than other global markets.
Given the high level of global macro uncertainty in the marketplace, it is not surprising to see consumer confidence recently near historical lows, investor sentiment near 35-year lows, and investors increasing cash holdings to levels not seen since April 2020 market lows. Wide market fluctuations, rising market fears, and sentiment extremes have historically been good long-term contrarian indicators for value investors. History has shown higher levels of marketplace uncertainty create significant market dislocations which provide attractive investment opportunities for a patient investor who is able to take a longer time view. As we highlighted post the Covid downturn in our Q2 2020 letter, “Don’t Forget Value,” smaller market capitalization companies and cyclicals tend to be some of the hardest hit areas during periods of rising market uncertainty, often experiencing significant valuation contraction. Rising market fears of a recession cause the marketplace to flee small caps and cyclicals in search of “perceived stability.” Regardless of historical wide relative valuation spreads, the marketplace remains crowded in “Growth, Stability and Defense” sectors.
AAII Sentiment Survey Results
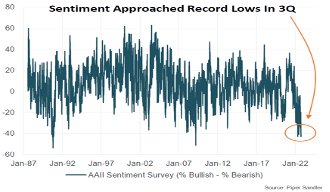
Source: Piper Sandler. The chart uses historical AAII Sentiment Survey data, which is available here. More information is provided in the disclosures at the end of this piece.
In our Q2 letter, “A Fork in the Road (Follow Value Signs)!,” we highlighted how cyclicals (Financials, Industrials, Energy and Materials) were still only approximately 25% of the S&P 500, which was a significant decreased weight in the index since 2015 resulting from Growth’s strong performance over Value. The current weighting in cyclicals remains much lower than the 1973-1974 trough (high 30s) and even below the 2000 trough (30%). It is important to note that from those two prior troughs, the cyclicals representation in the S&P 500 Index increased by 1000-1500bps over the following 5 to 7 years. Today, a smaller rotation to Value could have a similar impact as historical time periods. Currently, a 1% rotation out of Growth, Stability, and Defense sectors of the market would increase cyclical market representation by nearly 4% (a 100-year high).
While the S&P 500 only has about a quarter of its weighting in cyclicals, there are much higher weightings in Value indexes. As the chart below highlights, the S&P 1500 Value index cyclical weighting is still more than twice the S&P 1500 Growth index weighting and the small-cap S&P 600 Value index is more than three times. There is also a sizable difference between Technology and Energy sector weightings within the indexes. We find it interesting that these sector weightings are not aligned with their expected earnings contribution. The Energy sector weighting in the S&P 500 Index is still less than 5% while their earnings contribution is expected to be greater than 10%. Meanwhile, the Technology sector earnings contribution is expected to be less than 20%, much lower than their 26%+ sector weighting. We see the likelihood of Energy equities increasing over time given the sector’s discounted valuation multiples and the significant lack of investment over the past 10 years. The Technology sector weighting faces ongoing headwinds from above market valuation multiples, profit margins near all-time highs, and 58.6% of the sector revenue coming from outside the U.S.
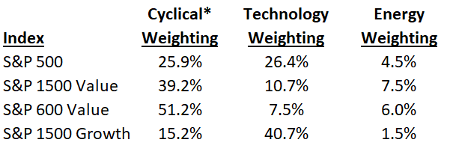
*Energy, Financials, Industrials, and Materials.
Source: Standard & Poors, Thomson Reuters
As the chart below highlights, the market composition also captures the ongoing market bifurcation near 2000 and 2020 extremes. The top 5 market cap companies are above 40% and the top 25 are at 22%. The significant outperformance of longer duration (growth-oriented) equities that started in 2015 was driven by significant valuation multiple expansion and supported by historical low interest rates. Longest duration equities have been under pressure this year as interest rates have been increasing. However, the most expensive subset of the market remains above their historical average valuation, at earnings yields near 2% (half of current interest rates!). Further rate increases can lead to an even greater discount for longest duration equities.
% of Market Cap – Top 5 (Blue) and Top 25 (Gray) Stocks
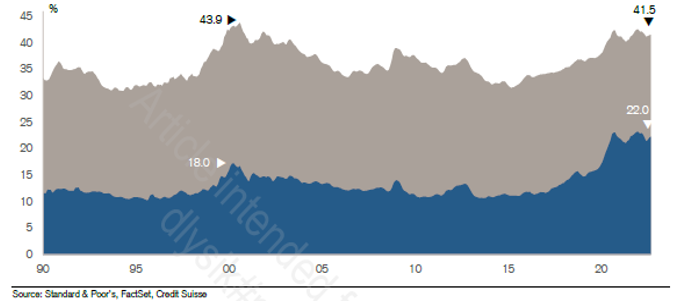
Source: Credit Suisse
The lowest valuation subset of the market (which has significant cyclical and smaller market capitalization exposure) remains near the lower end of their historical valuation range. With price-to-earnings multiples approaching five times, the least expensive portion of the marketplace has a forward earnings yield approaching 20% – nearly five times current interest rates! With absolute and relative valuation multiples near historical troughs, lower valuation securities are already discounting future earnings and cash flow levels well below their long-term normalized levels. In our opinion, these wider price-to-value gaps create greater value opportunities with rising margin of safety and higher long-term return potential. We’ve seen a repeated pattern in historical corrections (including recessionary time periods): lower valuation securities not only bottom before an economic trough, but they also tend to lead the overall market during the recovery time-period. History suggests the marketplace will broaden out over the coming year and favor lower valuation securities which are at significant discount to the market and remain below historical average representation in the marketplace.
Where could we be wrong with our views? The Federal Reserve remains on an overly aggressive interest rate tightening path even as inflation rates start to decline. This could pose a risk of an earnings recession greater than what is already discounted in the marketplace, creating ongoing headwinds for the overall market. Historical earnings recessions during higher inflation time periods have been much shallower than earnings recessions in lower inflation time periods. During the 1970s to early 1980s, there were three earnings recessions, averaging a 15% contraction in earnings. However, it is interesting to note that cyclicals outperformed other portions of the marketplace during the 1970s. In the present environment, elevated earnings yields of cyclical and smaller companies appear to be already discounting significant earnings contraction next year. Longer duration equities that are at peak margins or lack free cash flow generation would have greater headwinds from a higher-than-expected future discount rate.
While market uncertainty may persist over the coming months, low valuation securities appear to be on sale and their trough valuation levels appear to be already discounting elevated market fears!
Strategy Highlights
For the third quarter, the Deep Value Strategy was down 14.7% (net of fees), which was more than the S&P 500 index and the S&P 1500 Value Index. Year-to-date, the Strategy is down 23.4% (net of fees), which was ahead of the overall market but behind the S&P 1500 Value Index. As we have highlighted previously, the Strategy is susceptible to quarterly fluctuations and, like the past, double-digit negative performance has accompanied significant valuation compression. Some historical larger drawdowns have tended to be relatively short-term in nature and they have led to very strong future 1-year investment returns. As an example, the Deep Value Strategy was negatively impacted late in 2018 and again in the first half of 2020. In both time periods, the Strategy’s average drawdown was more than made up over the following 6 to 12 months.
During the quarter, the two largest positive contributors were TechnipFMC (FTI) and Bed Bath & Beyond (BBBY). Both companies’ share prices traded more than 25% higher in the market. TechnipFMC was a new investment made over the past year. We believe the company remains well positioned to gain incremental market share in the current multi-year upcycle for the subsea marketplace. TechnipFMC has industry leading innovation, their integrated offering, iEPCI/Subsea 2.0 platform and configure-to-order model is eliminating engineering costs for new projects and significantly reducing completion time (by up to 1 year).
Bed Bath & Beyond saw significant volatility during the quarter as the share price increased from less than $5/share to more than $20/share at one point. Bed Bath’s management has had ongoing challenges with their turnaround plan. With the company balance sheet significantly weakening over the past two quarters and reports of vendor relationships becoming strained, we see significantly less margin of safety. We decided to take advantage of the price strength during the quarter and exited our position at a profit.
We also exited Endo Pharmaceutical (ENDP) during the quarter realizing an unfortunate significant loss on our investment. Endo’s management decided to file for bankruptcy during the quarter, which was surprising given >$1B in cash on the balance sheet, limited near-term maturities, and new initiatives that had the potential to improve operating results over the coming year. We were also disappointed to see that the company’s bankruptcy plan favors certain stakeholders, and management’s interests are being placed ahead of current shareholders.
During the quarter, our two largest detractors were Nabors Industries (NBR) and Gannett (GCI); both companies’ share prices in the market were down more than 20%. Nabors’s share price was negatively impacted by the recent pullback in energy prices as the shares fell more than 50% from its 52-week high. We viewed the recent pullback as an opportunity, increasing our position size during the quarter. Nabors remains significantly mispriced in our opinion and is well-positioned to benefit from strong ongoing demand in their global high spec rig fleet. We believe the marketplace is overlooking the ongoing improvement in industry utilization rates, as larger players have favored profit improvements of their current fleets versus undergoing a new build rig cycle. In addition, the Nabors heavily discounted share price appears to us to offer investors a wonderful opportunity to obtain their NDS (Nabors Drilling Solutions) segment at a fraction of its fundamental value. The segment’s proprietary technology offerings are growing revenues more than 30%, with greater than 50% gross margins and given its capital light model, converting 90% of segment EBITDA (Earnings Before Income, Taxes, Depreciation, and Amortization) to free cash flow!! As the company’s NDS segment and International Joint Venture continue to scale, we believe the marketplace will recognize the reduced free cash flow cyclicality and free cash flow conversion improvement to greater than 50% of EBITDA over the long term. Nabors management recently highlighted how ongoing profit improvement in their U.S. land business would support higher operating results in 2023. The company raised guidance, expecting $1B in EBITDA (versus $800M) and significant ongoing debt reduction, improving debt leverage to 1.7x at the end of next year. In our opinion, Nabors’s shares remain at a significant valuation discount to its peers (50-70% on various valuation measures), with a normalized Enterprise Value (EV)-to-EBITDA multiple that is approaching two times and free cash flow yield greater than 40%. We continue to see upside share price potential over the next couple of years of more than three times from current levels.
Gannett’s recent results were disappointing, as ongoing secular headwinds that face the newspaper portion of the business weakened further. In addition, ongoing inflation (newsprint, paper, delivery, and wages) added $50M in incremental costs in the first half of the year. To further accelerate the company transformation, management is undertaking a significant cost reduction program (15-20% of total costs), removing a significant amount of fixed costs from the company’s business model. The cost reduction program is expected to be fully implemented in the fourth quarter and initiatives are designed to generate more than $200M of annual cost savings. Importantly, Gannett’s ongoing growth initiatives remain on track; digital subscription business and digital market solutions which carry attractive margins should eventually help the company return to growth over time. In the meantime, as the cost reduction plan enhances profitability, management plans to continue to aggressively reduce their overall debt levels. Over the past 3 years, Gannett has paid off close to $600M in debt and year-to-date has already reduced debt by $130M. With ongoing non-core asset sales, Gannett is expected to maintain ongoing debt reduction which should unlock significant equity value over time. With the current market capitalization below the company’s normalized EBITDA and free cash flow, the marketplace fears of further secular challenges and potential recession impact appear significantly discounted in the share price. We remain patient with Gannett management’s multi-year transformation plan and believe the significant cost reduction program, further debt reduction, and extensive asset base provides a sufficient margin of safety in the near-term. With the share price near all-time lows, we see a significant price-to-value gap and believe long-term upside potential remains at multiples of the current price level.
During the quarter we also scaled up a new investment in Tutor Perini (TPC). The company’s Civil segment is a leading provider of complex construction and rehabilitation of critical infrastructure (highways, tunnels, bridges, mass transit). Tutor has been in business for over 125 years and appears well positioned to benefit over the next couple of years from the recently passed $1.2T federal infrastructure law. Their integrated business model provides competitive advantage in bidding, providing greater transparency in price and greater control of the large project work schedule. TPC’s stock price has been more than cut in half over the past year (near early 2020 lows) as the Covid outbreak caused a delay in larger Civil contracts. This is now weighing significantly on segment margins, creating an earnings trough this year. Tutor’s recent new business wins are helping to rebuild their pipeline (Civil segment backlog approaching $5B which is 200% higher than segment current annual revenue run-rate). In addition, the company has been working through the legal system to litigate for past due work. While Covid delayed some legal proceedings, these outstanding cases are now being settled, having recently added more than $100M to cash flow. With $500 to $700M of outstanding receivables, ongoing settlements provide a nice margin of safety to the balance sheet. This has the potential to generate significant incremental free cash flow. TPC’s shares look significantly mispriced, trading at a deep discount to tangible book value. Over the next couple of years, the company has the potential to generate earnings more than $3/share, as the Civil segment returns to historical average margins. Upside potential appears more than three times the current market price as normalized earnings and free cash flow yield is greater than 40%.
At quarter-end, the Deep Value Strategy normalized earnings and free cash flow yield are greater than 30% and the Strategy is at a 60-90% valuation discount to the market and Value Indexes. With the recent drawdown, the embedded return potential in the Deep Value Strategy is approaching historical highs (last seen in early 2020). Historically, the Strategy has performed well coming out of performance drawdowns, as market prices narrow the wide gaps with our holdings’ underlying fundamental value. Over the past 4 years, the Deep Value Strategy has experienced three significant drawdowns, however the Strategy’s long-term performance has remained significantly ahead of the market. We attribute this to our patience and our commitment to our long-term perspective. The Deep Value Select Strategy annualized performance since inception is greater than 20% versus the S&P 500 Index at +7% and the S&P 1500 Value Index at 5%.
While it is difficult to know the duration of any downturn, we are confident that market participants will eventually recognize the significant price-to-value gap in low valuation securities over the coming year. We believe our Deep Value Strategy provides a distinct investment opportunity, highly differentiated from the overall index that allow investors to benefit from these ongoing market dislocations. While short-term volatility will occur, the Strategy’s very high concentration and high active share has the potential to be very additive to a client’s overall asset allocation over the long term.
We thank our clients for their ongoing trust and patience during these volatile time periods. We will continue to work hard with the goal of generating attractive investment returns over the long term.
Deep Value Select Strategy Composite Performance (%)
| QTD | YTD | 1-Year | 3-Year | Since Inception (10/1/18) | |
| Deep Value Select Strategy (Gross of Fees) | -14.44 | -22.76 | -29.16 | 45.81 | 24.79 |
| Deep Value Select Strategy (Net of Fees) | -14.67 | -23.36 | -29.89 | 44.39 | 23.55 |
| S&P 1500 Value Index | -5.74 | -16.70 | -9.90 | 5.20 | 4.96 |
Performance greater than one year is annualized. Past performance is no guarantee of future results. No representation is being made that any account will or is likely to achieve profits or losses similar to those shown. Portfolio holdings are subject to change at any time. For important performance information, please reference the Deep Value Select GIPS Composite Disclosure.