Deep Value Strategy 3Q 2021 Letter
During the third quarter, a resurgence of Covid-19 (delta variant) created growing concerns of potential headwinds to future demand and increased market concerns regarding a slowing economic recovery. As we have seen over the past couple of years, rising uncertainty and volatility tend to lead to lower interest rates and short-term pull backs in portions of the market that will benefit from an economic recovery. Not surprisingly, longer duration equities have recently fared better than the cyclicals and lower valuation securities as investors have crowded back into perceived “safe havens”. We continue to find it ironic that the marketplace believes these areas are “safe,” where a good portion of the underlying securities have P/E multiples between 50 to 100x. Elevated and rising valuation levels creates a rising risk of capital loss, which could not be any further from the descriptor of a “safe haven” asset.
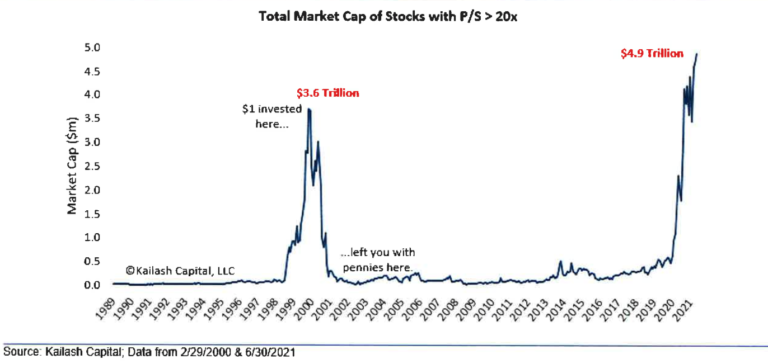
As the quarter progressed, we also saw valuation spreads widen further in the marketplace. Kailash Capital recently highlighted the growing number of longer duration equities in the marketplace. The first chart highlights total market capitalization of stocks with a price-to-sales greater than 20x.

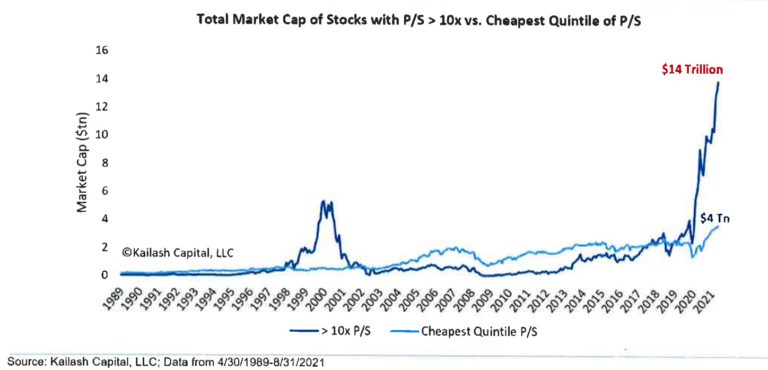
With record low interest rates driving lower discount rates, it is not surprising that the current total market capitalization is greater than early 2000 and increased further during the third quarter. While some of the constituents of the universe1 may end up being successful investments and support current valuation over time, Kailash’s historical work suggests that a vast majority of the universe will significantly lag the overall market over the coming years. At these very high valuation levels, market prices are already discounting very lofty future growth expectations well into the future, leaving the securities vulnerable to any future growth or profit disappointments and the potential for future valuation contraction. The second chart (below), looks at total market capitalization of companies with price to sales >10x and the cheapest valuation quintile. This portion of the market has also increased dramatically over the past couple of years, and now has a combined market capitalization of $14 Trillion – more than 3 times higher than the cheapest quintile.2

We also recently came across another industry study highlighting that, currently, ~25% of all equity securities are trading over 10x price-to-sales. The all-time high was in the late 1999/early 2000 period when more than 30% of equity securities traded over 10x price-to-sales.
We are not entirely surprised by these charts as the growth universe has generated superior historical earnings and free cash flow growth for most time periods since The Great Recession. Longer duration equities have also benefitted from significant valuation expansion over the past couple of years as a direct result of record low-interest rates (lower discount rate). However, with a very accommodative Federal Reserve and significant ongoing fiscal stimulus, there is a potential that economic and cyclical earnings growth may remain ahead of market expectations well into 2022 and beyond. In addition, strong demand, tight supply chains, and a tightening labor market are causing growing inflation pressures, which may also lead to a rise in interest rates over the coming years ahead of market expectations. The current environment appears to have many differences from the post-Great Recession period. Whereas, there appear to be more similarities going forward to historical periods that have resulted in lower valuation equities leading to the narrowing of market valuation spreads.
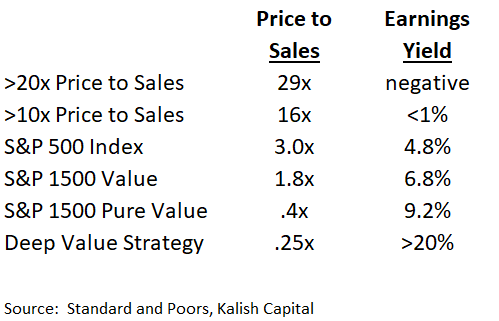
We continue to observe that valuation spreads between the most and least expensive portions of the market remain at elevated levels. As you can see from the chart below, the S&P 1500 Pure Value Index on a price-to-sales basis is at a >80% discount to the S&P 500 Index and an even greater discount versus the more expensive portions of the marketplace. On an earnings yield basis, the Pure Value Index is nearly 2x the overall market and significantly higher than the more expensive portion of the market, which has an earnings yield below the 10-year bond yield.

However, it is worth highlighting that the more expensive portion of the market revenue growth has been significantly higher than the overall marketplace over the past couple of years. While the market has clearly been favoring longer-duration equities, history has shown that there is an eventual ceiling for valuation multiples. As economic growth continues and interest rates rise over time, we would not be surprised to see valuation multiples start to compress in the most expensive subset of the market. However, lower valuation securities should continue to be beneficiaries from a broadening out of the marketplace as they benefit from improving operating results and valuation expansion. Within this subset of the market, we continue to see many unloved and significantly underfollowed companies. In some cases, companies may have significant embedded business that are being carried at a fraction of public market prices or recent market transactions providing an investor significant upside potential over time (as the market eventually takes notice) along with a sizable margin of safety.
Where could we be wrong with our view? With interest rates so far below normalized levels, it could lead to further valuation expansion and market concentration over the coming months. However, with inflation building in the economy, the current high valuation levels of long-duration assets place them in the crosshairs of any unforeseen increase in interest rates. The increasing sensitivity to rising rates could become a significant headwind to this portion of the marketplace over the coming years. Secondly, having seen how the uncertainty around Covid-19 impacts the financial markets, ongoing infections combined with a stronger-than-expected flu season (as it was virtually not present in 2020) could create some headwinds to future demand and rehash market concerns regarding a slower recovery.
On a positive note, recently Covid-19 Delta variant cases have begun to trend lower. In addition, we are seeing a growing global vaccinated population, additional Covid-19 booster vaccines coming to market over the coming months, and new Covid-19 treatments that have the potential to lessen the severity of future infections. We continue to see an environment supporting above average economic growth, rising inflation, and eventually higher interest rates. All have historically coincided with stronger returns for lower valuation securities, which should eventually tip the scale in Value’s favor.
Strategy Highlights:
After a strong start to the year, the Deep Value Strategy underperformed during the third quarter. The portfolio holdings experienced significant valuation compression during the first two months of the quarter. Historically when this has happened, the underperformance time period has been shorter in duration and the Strategy performs well over the following months. For the quarter, the Deep Value Strategy was down in excess of 10%, lagging the overall market and the S&P 1500 Value Index. The Deep Value Strategy remains well ahead of the market for the year, up in excess of 70%.
During the quarter, our only significant positive contributor was Gannett (GCI), which was up in excess of 20%. Management has an aggressive transformation plan that is starting to gain operational traction. Their content subscribers are beginning to scale and should eventually provide an attractive recurring revenue and cash flow stream that will allow the enterprise to return to growth. Achieving their 10M digital subscriber target should generate close to $1B in high margin annual subscription revenue. Secondly, Gannett is aggressively scaling a Digital Marketing Solutions (“DMS”) and Event/Promotion business. DMS currently serves more than 20K small- to medium- sized businesses, with only a 2% market share of a large market (>$18B); Gannet has a significant upcoming growth opportunity. Management is targeting more than $1B in combined revenue from these two efforts over the next couple of years. It is worth highlighting that similar businesses today in the marketplace are being valued at more than 5x revenue. Success of these new growth initiatives could generate more than $2B revenue at higher than average company margins. Even with the recent price increase, we believe Gannett still has limited success from the transformation reflected in its share price, as it has one of the lowest price-to-sales multiples in the marketplace (currently at .25x). The transformation plan has the potential to unlock significant additional equity value as the business mix shifts, free cash flow generation accelerates (normalized free cash flow yield >50%), and their valuation multiples start to narrow with the significant discount to their public company peers.
We invest in our companies with a long-term perspective. Our process is focused on understanding the fundamentals of the business and long-term fundamental value. We roll up our sleeves and dive deep into the names we hold, regularly speaking with management to better understand the asset base and key drivers of the business model. We see this as an advantage in periods where our companies may see short-term fluctuations in their share price, such as what happened in the third quarter. We are looking for embedded value that has significant realization potential over a time horizon much longer than the market’s somewhat shorter-term view.
Our largest laggard during the quarter was Bed Bath & Beyond (BBBY). As we have highlighted previously, not all transformations are linear and there is always the potential for a short-term pullback in executing the plan. We expect the operational pause will lead to marketplace skepticism and question the success of the long-term plan. The company has had some near-term challenges from weaker store traffic related to Covid-19 delta variant’s impact along with rising supply chain and transportation costs. However, we disagree with the marketplace view that these headwinds will continue to overwhelm the significant ongoing improvements that management is making to the core operations. We very much like the new CEO and his additions to his management team – strong executives with significant transformation experience. As the new initiatives further rollout over the coming quarters, we expect to see further improvement in future operating trends. Management is in the process of rolling out 8-10 owned brands, which should drive margin expansion and dramatically enhance the overall business model. Store brands are 1,000 basis points higher gross margin than national brands, and as they move from 10% to 30% of sales, they should become a significant positive profit contributor and help management achieve their long-term gross margin target of 38%. Bed Bath also continues to have a very strong balance sheet ($10/share in cash), and has been using non-core asset sales to complete a very accretive share buyback program (likely greater than 20% of the float by year-end). With the recent pullback, we see some similarities to GameStop early in their turnaround as the company aggressively reduced their shares outstanding (>30%) ahead of revenue stability and profit improvement. We believe success on Bed Bath’s transformation plan should see profits double over the next couple of years and should lead to significantly higher normalized earnings and free cash flow per share. At an enterprise value to revenue under .2x, we believe Bed Bath remains at a significant discount to its intrinsic value.
Nabors Industries (NBR) was also a significant detractor during the third quarter, negatively impacted earlier in the quarter from the short-term pullback in energy prices. Nabors continues to lead peers with strong execution, significantly outperforming peers in Lower-48 oil rig daily margins.3 The company’s international operations are also significantly larger than its competition and historically has been a strategic asset providing consistent cash flow. Over the coming years, we see Nabors’s International operations well positioned to benefit from the upcoming ramp of their Saudi Aramco JV and the anticipated upcoming recovery in drilling in those markets. Nabors also has significant proprietary technology assets that are gaining in popularity with others in the industry. A low capital-intensive business, further growth of their technology applications would be nicely accretive to company profitability and cash flow generation. Management is also looking to leverage their asset base to develop new growth opportunities to enable Nabors to benefit from the upcoming Energy transition (Geothermal). Over the past couple of years, Nabors has focused more on free cash flow generation and has successfully reduced total debt by nearly $1.5B and we see significant ongoing debt reduction that should drive incremental equity value. The company appears to be well positioned as a significant beneficiary over the coming years from higher oil prices and greater global demand for their higher spec land rigs. We believe Nabors has the potential for significant share price appreciation, as free cash flow returns to normalized levels and the company’s valuation further expands and narrows the 70% valuation discount with their peers.
Pitney Bowes (PBI) was also a recent laggard off nearly 20% during the quarter. The company has been building out an E-commerce business for the past 10 years that is approaching $2B in revenue and growing revenues longer-term at a double digit pace. With the E-commerce segment approaching scale, management has significant new initiatives underway to help improve the segment’s profitability to normalized levels (8-12% EBIT margins) over the next couple of years. Success on achieving normalized profitability for the segment would dramatically enhance Pitney Bowes earnings (>$1 in EPS) and annual free cash flow generation (>$250M). Last quarter we highlighted, the digital service business within Pitney’s E-commerce segment and the significant embedded value that was suggested by recent acquisition of a direct competitor Stamps.com at 8x revenue. However, another recent market transaction suggests the E-commerce business has even greater embedded value. At the end of the second quarter, Global-e (GLBE), a UK company that focuses on cross-border business came public at $25/share or approx. $4B market capitalization. The initial IPO price suggested, 2021 Enterprise value to Revenue >20x. Since the IPO, GLBE has climbed to greater than $50/share. Within Pitney Bowes’s E-commerce segment there is a much larger cross border business representing approximately $500M in revenue. The current valuation of Global-e suggests Pitney’s cross border business is worth significantly more than the company’s current market cap. With the marketplace valuing many businesses in excess of 10x revenue, we believe that Pitney Bowes shares remain significantly mispriced at only .35x of revenue and >30% normalized earnings and free cash flow yield. In our opinion, the shares are becoming increasing attractive as their E-commerce segment appears to be significantly undervalued and has the potential to unlock significant equity value over the next couple of years.
We did make a new investment this quarter, Quad/Graphics (QUAD). The company has been operating for 50 years and is a leading worldwide marketing solutions provider. While the company built its reputation on providing print marketing products, Quad has developed a larger integrated marketing platform that helps marketers and content creators improve efficiency and effectiveness. Over the years, Quad has used their size and innovation to provide incremental services to their clients and improve their scale and profitability. As the economy continues to recover, management sees an improving sales environment and strong cash flow generation, which should allow the company to accelerate the de-levering of the balance sheet. In addition, a recent transaction also highlights the significant potential value in Quad shares. Chatham Asset Management recently offered $7.50/share to buy the rest of R.R. Donnelley & Sons. The valuation multiple for the transaction, implies that Quad/Graphics could be worth more than $15/share. With the company at a cash flow multiple near 1 times and >70% normalized free cash flow yield we see significant upside potential over the next couple of years, as the company has a market capitalization under $300M and, yet, is generating close to $3B in revenue.
We remain very excited about the embedded long-term return potential in the Deep Value Strategy holdings today. Our current portfolio holdings are well below their prices highs, unlike the overall market. Nearly 70% of the portfolio names are trading70% below their 5-year price highs. There are significant price-to-value dislocations within the portfolio, as the weighted average revenue is approximately $5B and market capitalization is less than $1.4B. We believe the portfolio holdings going through transformations provide a unique high return potential, very similar to overall stock market near trough valuation multiples coming out of deep profit recession. With a normalized earnings and free cash flow yield greater than 30%, the Deep Value Strategy is at valuation levels that have historically led to very attractive future returns.
We appreciate our clients’ trust and look forward to working hard to generate attractive investment returns over the coming years.
1The universe is defined as all US companies with price-to-sales greater than 20x.
2The cheapest quintile in the US market based on price-to-sales.
3The Lower-48 rig daily margin represents the daily profitability for drilling rigs located in the US contiguous states.
