
Deep Value Strategy 3Q 2020 Letter
The market recovery that began during the second quarter continued throughout most of the third quarter. Growth and momentum stocks continued to lead the equity market at a record pace, beneficiary of low-interest rates and superior near-term earnings growth. However, as the quarter came to an end we came across some interesting data-points that suggest a timely opportunity in “unloved” Value stocks.
We recently looked back at historical periods prior to a multi-year improvement in Value performance and saw a considerable amount of similarities to today. First, the marketplace was at record high levels of concentration which broaden out and over the following 5+ years, Value securities outperformed the market. As the chart below highlights, over the past 3 years the market concentration has increased by a considerable amount. The weighting of the top 5 of the S&P 500 Index is now more than 20% and the top 10 are approaching 30%.
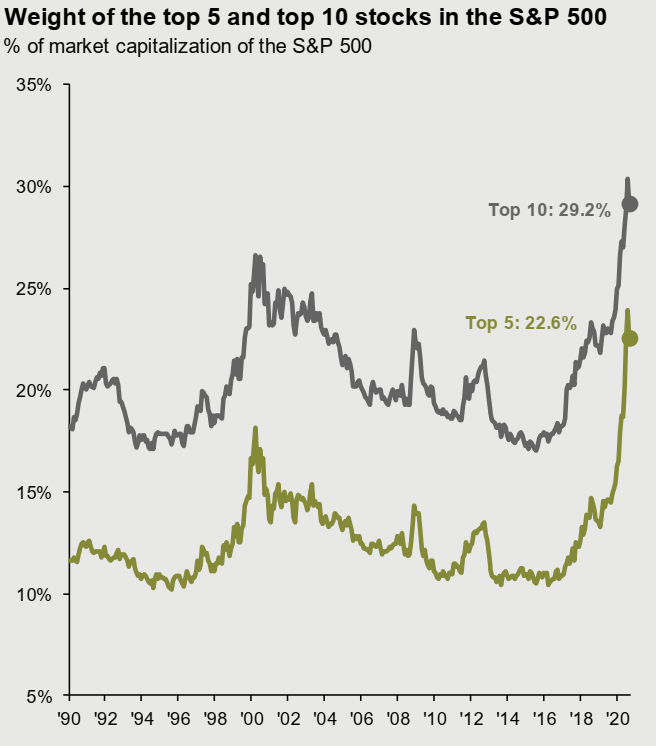
These levels are now considerably higher than in the early 2000 time period. At the end of the third quarter, the combined market cap of the top 30 companies of the S&P 500 was equivalent to the combined market capitalization of the bottom 470!
Taking a closer look, we see that the level of concentration in the S&P 500 Index is being driven by Growth stocks that have shown superior profitability over the past couple of years and recently have also benefitted from valuation expansion as interest rates have fallen towards historical lows. As the chart below highlights, the S&P 1500 Growth Index concentration is at its highest levels in 25 years and significantly more concentrated than the S&P 1500 Value index, while the S&P 1500 Pure Value Index has extremely low concentration levels. Recently, we have started to see some early signs of the market participation starting to widen out, expanding beyond large caps to include mid-cap and small-cap stocks. A further broadening of the market over the coming months should be very supportive of Value securities.
Index Weighting
| Top Holding | Top 10 | |
| S&P 1500 Growth | 10.2% | 41.0% Highest level in 25 years |
| S&P 1500 Value | 3.6% | 19.3% |
| S&P 1500 Pure Value | 1.3% | 11.1% |
Secondly, there are similarities in the market’s composition today and the historical periods we reviewed. As we highlighted in our last quarterly letter, the “Growth, Stability and Defense” sectors continue to see valuation expansion supported by lower interest rates, perceived earnings stability, and belief that future earnings growth will remain stable or at rates greater than the overall market.
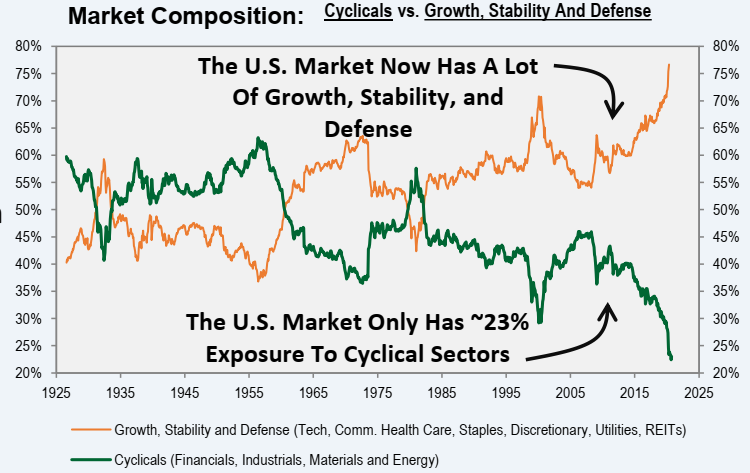
The economic downturn has caused cyclical sector representation in the S&P 500 to fall to all-time lows, 23%, significantly lower than the 30% trough in early 2000s levels and the high 30s in the early 1970s. These prior troughs marked an inflection for Value stocks. As the chart below highlights, the S&P 1500 Value Indexes are more than 2x higher than the S&P 1500 Growth Index.
Cyclicals Weight
| S&P 1500 Growth | 15.5% |
| S&P 1500 Value | 37.2% |
| S&P 1500 Pure Value | 52.4% More than 3x Growth |
While cyclicals have been adversely impacted by the Covid-19 led recession, the market seems to be forgetting that cyclicals should also be some of the biggest beneficiaries from the ongoing economic recovery. If you look at consensus earnings expectations over the next 6-8 quarters, cyclicals are expected to have significantly improving profitability trends, 20-30%+ earnings growth next year which will likely lead the overall marketplace. Most cyclical securities remain significantly out of favor, unloved, and possess some of the largest price-to-value divergences in the marketplace.
Finally, valuation spreads within the equity marketplace remain near historical wide levels (as we noted in a previous letter). The current environment is very similar to the early 1970s and early 2000s. As the chart below highlights, Value and Growth forward P/E ratios have widened by 40% since 2017.
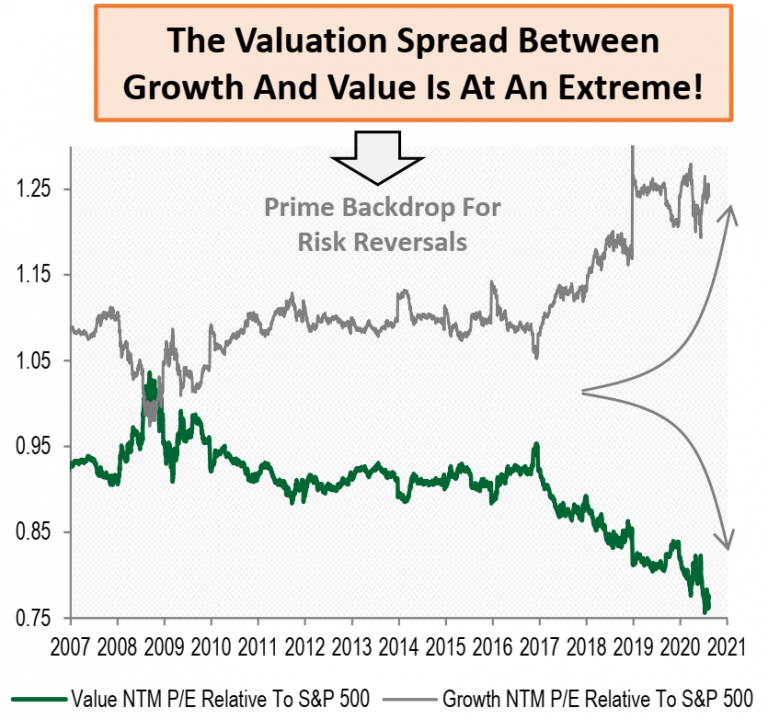
However, one can make a strong case that the valuation spread is even wider as low valuation and cyclical companies are far from normalized profitability and earnings power. These companies will likely see strong growth as the economy continues to recover over the coming 12 to 24 months from a deep economic contraction. If we look at other traditional valuation measures, you can get a greater appreciation for how wide valuation spreads are between the Value and Growth universe.
| Price to Cash Flow | Price to Book | Price to Sales | |
| S&P 1500 Growth | 27.3x | 6.6x | 3.9x |
| S&P 1500 Value | 16.7x | 1.9x | 1.2x |
| S&P 1500 Pure Value | 3.5x | 0.7x | 0.2x 90% discount to Growth |
The S&P 1500 Pure Value index is at a 90% discount to Growth today, an all-time high! With a very accommodative Federal Reserve, additional fiscal stimulus likely by year-end and Covid-19 eventually have less of an impact on the economy (further treatment advances/vaccine) there is a strong likelihood that valuation multiples will begin to expand for Value securities as the economic recovery continues.
Where could we be wrong with our view? As we have seen in the recent past, significant marketplace uncertainty could resurface. During historical time periods of rising uncertainty and volatility, we have seen interest rates move lower and the equity market to favor Defensive and Growth investments. The upcoming election and/or the response to rising Covid-19 infection rates are the most visible near-term risks. However, it is worth mentioning that those two near-term risks are well known to the marketplace and a daily market focus. History would suggest their impact would have to be even greater than what is already being expected or discounted in the market. We would also suggest that a very accommodative Federal Reserve and incremental Fiscal stimulus could more than offset these concerns. Historically, when both have been present, it’s been a precursor to strong future economic growth, a steepening of the yield curve, and the beginning signs of inflation (all favorable to the Value universe).
We like the green shoots that are starting to emerge and believe there is a very good set-up for Value stocks to do much better heading into 2021, and possibly sooner!
Strategy Highlights
During the third quarter, the Deep Value Strategy led the overall marketplace and S&P 1500 Value index, generating returns in excess of 25%. For the first nine months of the year, the Deep Value Strategy is now more than 15% ahead of the S&P 1500 Value index. As we highlighted previously, the strategy tends to generate very strong investment returns following a time period of significant valuation contraction.
During the quarter, nearly half of the holdings were up in excess of 20% and we had two holdings up in excess of 100%. Our largest detractor during the quarter was Nabors Industries (NBR), which was down approximately 30%, weighed heavily by the recent pullback in oil prices. As we highlighted in our last quarterly letter, we see the company making significant advances in improving their balance sheet and lowering their cost structure to weather the current weak industry conditions. We believe Nabors’s normalized earnings and cash flow are significantly higher than current levels and upside potential could be multiples of the current share price. Teva Pharmaceutical (TEVA) and Endo International (ENDP) were also weaker during the quarter on concerns of future Opioid litigation liabilities. We continue to believe that the ultimate settlements for both companies will be very manageable and their current market prices are over-discounting these market fears. Historical industry settlements would also support lower amounts being paid out over lengthy time periods. Both companies are making significant improvements to their cost structure and have significant new product potential that will drive continued improvement in earnings and free cash flow. With normalized earnings and free cash flow yields between 30-50%, we see long-term upside potential multiples of the current share price.
Bed Bath & Beyond (BBBY) and GameStop (GME) two of our largest detractors in the first quarter of this year, were two of our strongest performers during the third quarter. Their recent earnings reports show a similar story, new management teams successfully accelerating their transformations, through the monetization of non-core assets and generating significant free cash flow by lowering cost structure and improving their working capital management. Both companies delivered significant improvements to their already strong balance sheets moving to a net cash position. We continue to see significant upside potential in their share prices as the market starts to focus on the future enhancements to their business model and the ability to deliver significantly higher normalized free cash flow and earnings power.
We also saw Signet Jewelers (SIG) start to deliver improved performance during the quarter and believe their initiatives on closing unprofitable stores, expanding new Omni-channel capabilities, and launching new product offerings should begin to drive an improvement in their operations over the coming quarters. Historically, Signet’s stock price has performed very well coming out of an economic downturn. With the company valuation multiples near 2009 lows, it wouldn’t take much to see Signet’s share price double during the ongoing economic recovery. While we are highlighting the consumer space, we also wanted to mention a new investment, Chicos FAS, Inc. (CHS). The investment opportunity reminds us a lot of Bed Bath and GameStop earlier this year: a new CEO who is executing well on a new transformation plan, closing unprofitable stores, significantly streamlining and realigning their operations, and enhancing new product for their Chicos, White House Black Market, and Soma brands. Chicos has an asset-rich balance sheet, nearly $1.4B in total assets. The company’s real estate assets (land and buildings) combined with the cash on the balance sheet are significantly higher than the company’s current equity market capitalization! Over the next couple of years, the company has the potential to return to a $2B+ revenue base, which would support $100M in free cash flow. We believe a successful turnaround over the next couple of years has the potential to drive the share price 5-10x higher than current levels.
Pitney Bowes (PBI), a holding that we added earlier in the year has also been a very positive recent performance contributor. Covid-19 has created a surge in demand for Pitney Bowes’s e-commerce services. During the past two quarters, the company has added nearly 170 new customers. Onboarding these new clients over the coming quarters and the ongoing double-digit industry growth should support e-commerce segment revenue to be greater than $2B over the next couple of years. Over the coming quarters, management is focused on improving the segment’s profitability, lowering transportation, warehouse, and employee costs per piece. Over the next 2-3 years, achieving targets of 8-12% EBIT margins has the potential for the E-commerce business to drive a $250M positive delta in profits, $200M in incremental free cash flow, and contribute more than $1 in incremental EPS. Looking at comparative businesses in the marketplace suggests that the e-commerce segment on a stand-alone basis is worth more than $12 a share. Pitney Bowes also has a Send-Tech Solutions and Presort business that has had more challenging growth trends and is currently recovering from a cyclical trough. These two businesses have a combined opportunity over the next couple of years to generate normalized earnings of ~$1/share and $200M in free cash flow. We believe Pitney Bowes has significant further upside potential as the current share price has a normalized free cash flow and earnings yield over 30%.
Finally, I’d like to highlight Atlas Corp (ATCO), we have been increasing our investment over the past couple of months. Atlas was formed earlier this year as a holding company. The entity owns Seaspan, the largest independent owner and operator of containerships in the world, and APR, the largest mobile gas turbine fleet owner and operator in the world, providing power solutions to customers, including large corporations and government-sponsored utilities. Atlas is led by CEO Bing Chen and Chairman David Sokol. David had a fantastic track record building MidAmerican Energy, which was purchased by Berkshire Hathaway and renamed Berkshire Energy. In 20 years at MidAmerican Energy, Sokol grew revenue from $116M to $11B and net income increased from $27M to $1.2B, a compounded growth rate of 22.4%. During this time, their ROE averaged 23%. Atlas has partnered with Fairfax and the Washington Family who control nearly 60% of the float and are highly supportive of creating long-term value for shareholders. Atlas has a significant backlog, more than $4B of long-term reoccurring revenue contracts, and the company has significantly reduced its capital intensity in the Seaspan business. The stock has been under pressure to start the year as world trade shipping volumes were down 5-10%, impacted by Covid-19. Atlas management continues to exceed expectations, maintaining Seaspan’s fleet utilization in the upper 90s. We see the potential for the company to generate significant free cash flow over the next couple of years and currently has a normalized free cash flow yield greater than 30%. Atlas shares are very attractive at a 40% discount to book value, less than 3x cash flow and the company also possesses an attractive 5.4% dividend yield.
We continue to be focused on generating attractive absolute returns for clients over the long-term as we act like business owners making investments in out-of-favor securities whose market price is at a significant discount to its fundamental value. We continue to believe there is significant embedded return potential in each of our holdings. The Deep Value Strategy today has a normalized earnings yield greater than 25% and greater than 40% normalized free cash flow yield which are multiples of the overall market today. If there is a narrowing of valuation spreads and further improvement in low valuation (cyclical) securities, history has shown that the Deep Value Strategy will likely be a significant beneficiary.