
Deep Value Strategy 1Q 2020 Letter
The past 8 weeks have been extraordinary. The impact of the global pandemic, a black swan-like event, is being felt in more than 130 countries. As healthcare companies work on a vaccine, the near-term treatment to lessen the health impact is social distancing, which ironically creates an even greater near-term global economic impact. As Covid-19 spread, so too has the economic impact, as market volatility during the quarter increased to levels last seen in 2008-09 and equity market selling accelerated, registering its quickest ever 30% correction. The Federal Reserve and Treasury took appropriate swift actions to provide significant liquidity to the financial system and new creative measures were undertaken that should help dampen the near-term economic fallout.
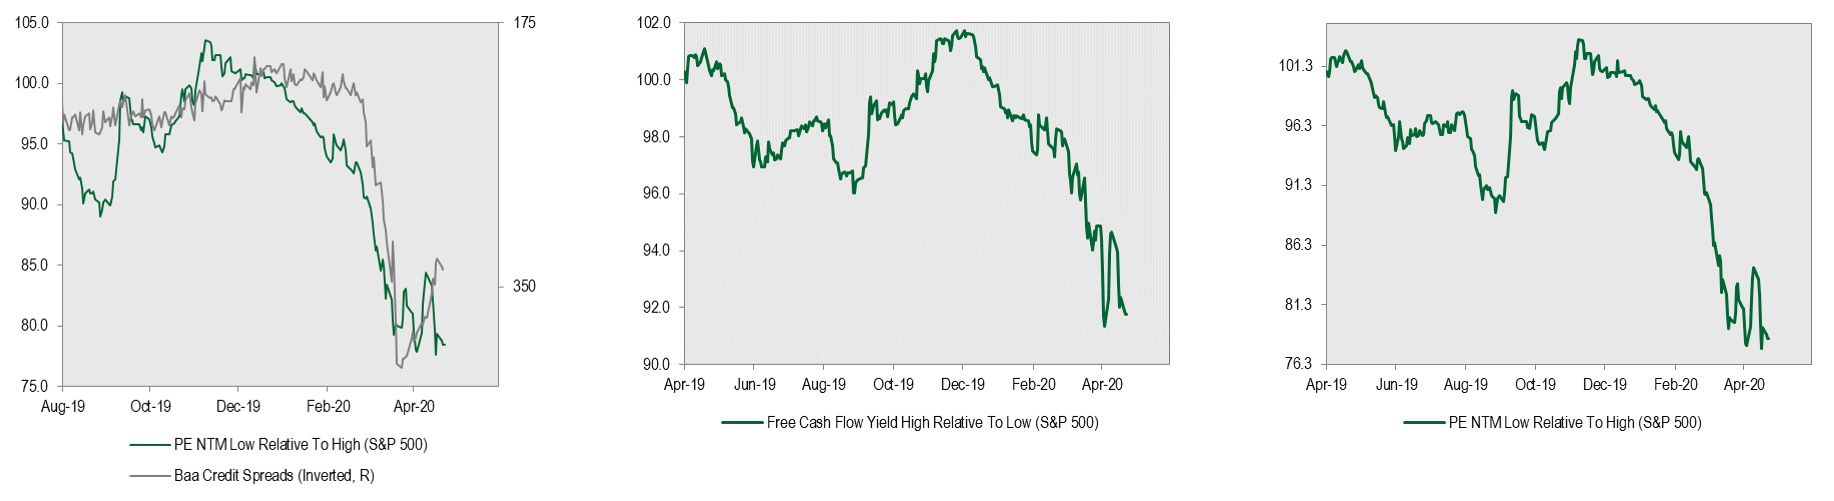
We highlighted in our Q3 letter how the marketplace had significantly favored low volatility and longer duration equities. Low valuation securities experienced significant multiple contraction during the summer months which quickly reversed from mid-August to December. With current marketplace fears of a recession rising, the charts below highlight how low valuation companies have significantly lagged the overall market. Valuation spreads have significantly widened past levels seen last August! In previous letters, we highlighted how the most attractive valuation securities have outperformed the overall market over long time periods. However, we have seen significant short-term periods of underperformance, as the price-to-value gap widens. These time periods have been followed by significant appreciation and relative outperformance. Price discovery has historically been faster during recovery time periods. While market participants continue to overweight crowded low volatility and long-duration equities, an investor appears much better served taking a longer time horizon by focusing on companies with significant price dislocation that have normalized earnings and free cash flow yields that are significantly higher than the overall market.
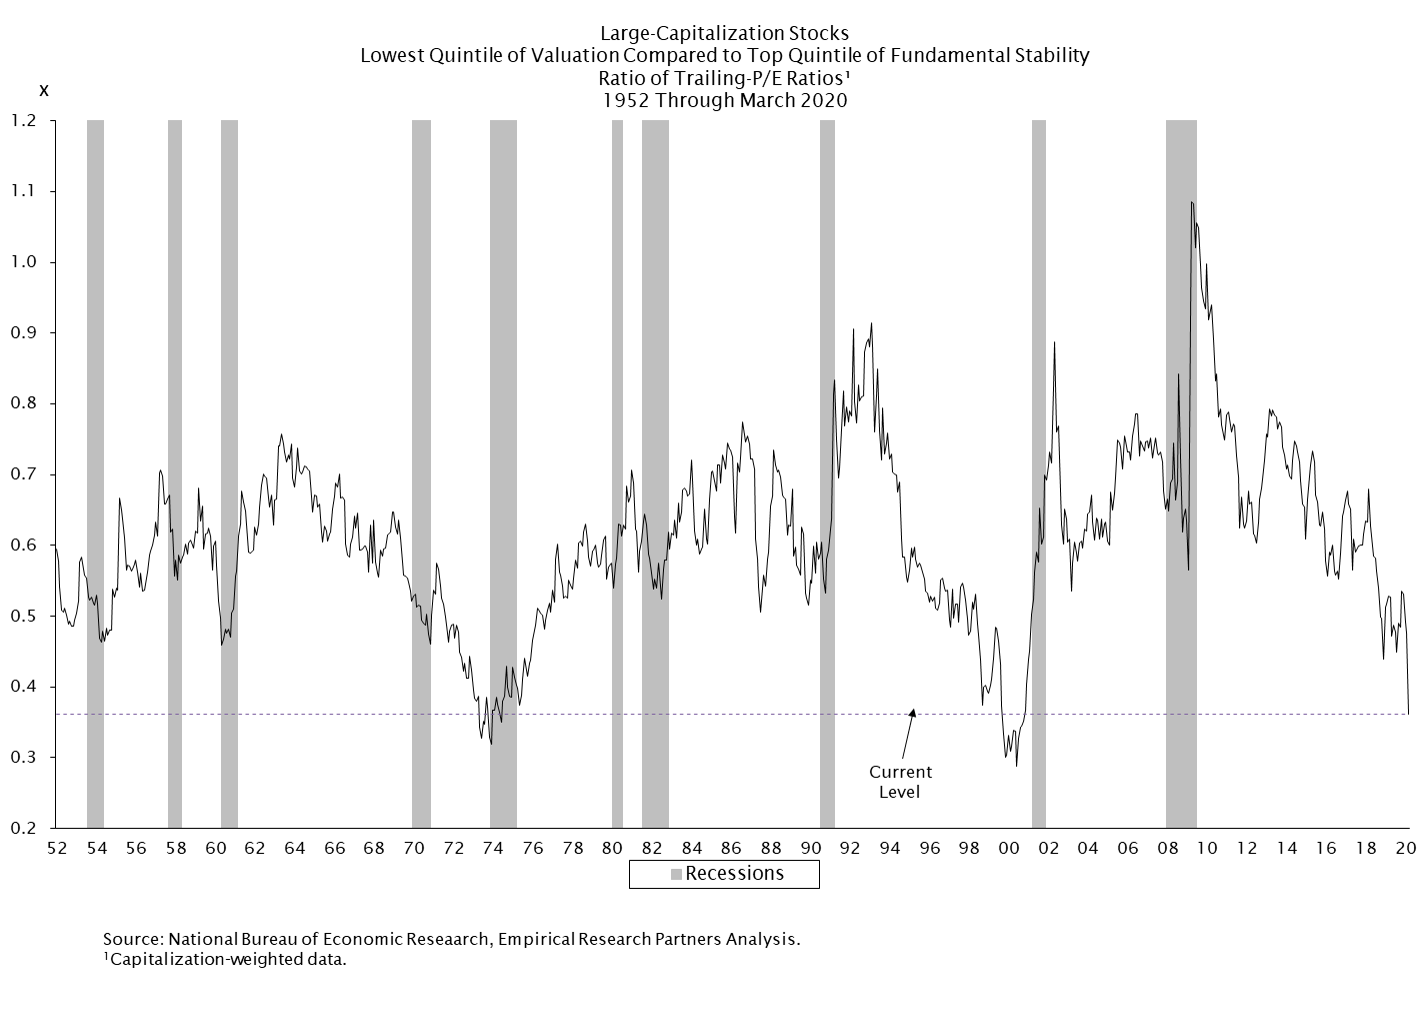
A recent piece from Empirical Research Partners further highlighted the extreme nature of current valuation spreads versus history. As the chart below depicts, the current environment has only occurred during two other time periods in the past 70 years: 1973-74 and 1999-2000. Both periods preceded recessions and also led to strong long-term performance cycles for Value securities. In the early part of these historical time periods, low valuation securities actually led the market lower on fears of a recession and the slowdown unfolding. However, as the economic slowdown took hold the market began to look forward to a recovery and Value started outperforming across all market capitalizations.
Some market participants may suggest that low volatility and longer duration equities will continue to outperform the market regardless of valuation due to lower interest rates and greater economic uncertainty. While this may be true in the near-term, history would suggest that future outperformance may be more challenging for these perceived safe haven groups. As Benjamin Graham highlighted on numerous occasions “In the short run, the market is a voting machine but in the long run, it is a weighing machine”. The price-to-value relationship wins out over the long-term. History would suggest there are numerous ways for extreme valuation spreads to narrow. If the slowdown persists, it may potentially dampen growth for all market participants, which could cause a potential rerating of higher valuation and low volatility equities that are discounting stability and higher future growth. The significant stimulus currently helping to stabilize global economies should lead to a recovery in economic growth later this year. Historically, these time periods have been followed by rising inflation expectations and interest rates, which could have a greater impact on longer duration equity valuations. Finally, as the marketplace begins to look forward to an upcoming recovery, investors may begin to recognize the significant price-to-value divergence in lower valuation companies (cyclicals) with attractive long-term business value supported by higher future normalized earnings and free cash flow. In the post-2000 trough, Value began to outperform the market from similar trough absolute valuation levels, quickly erasing the prior 10-year outperformance of Growth versus Value.
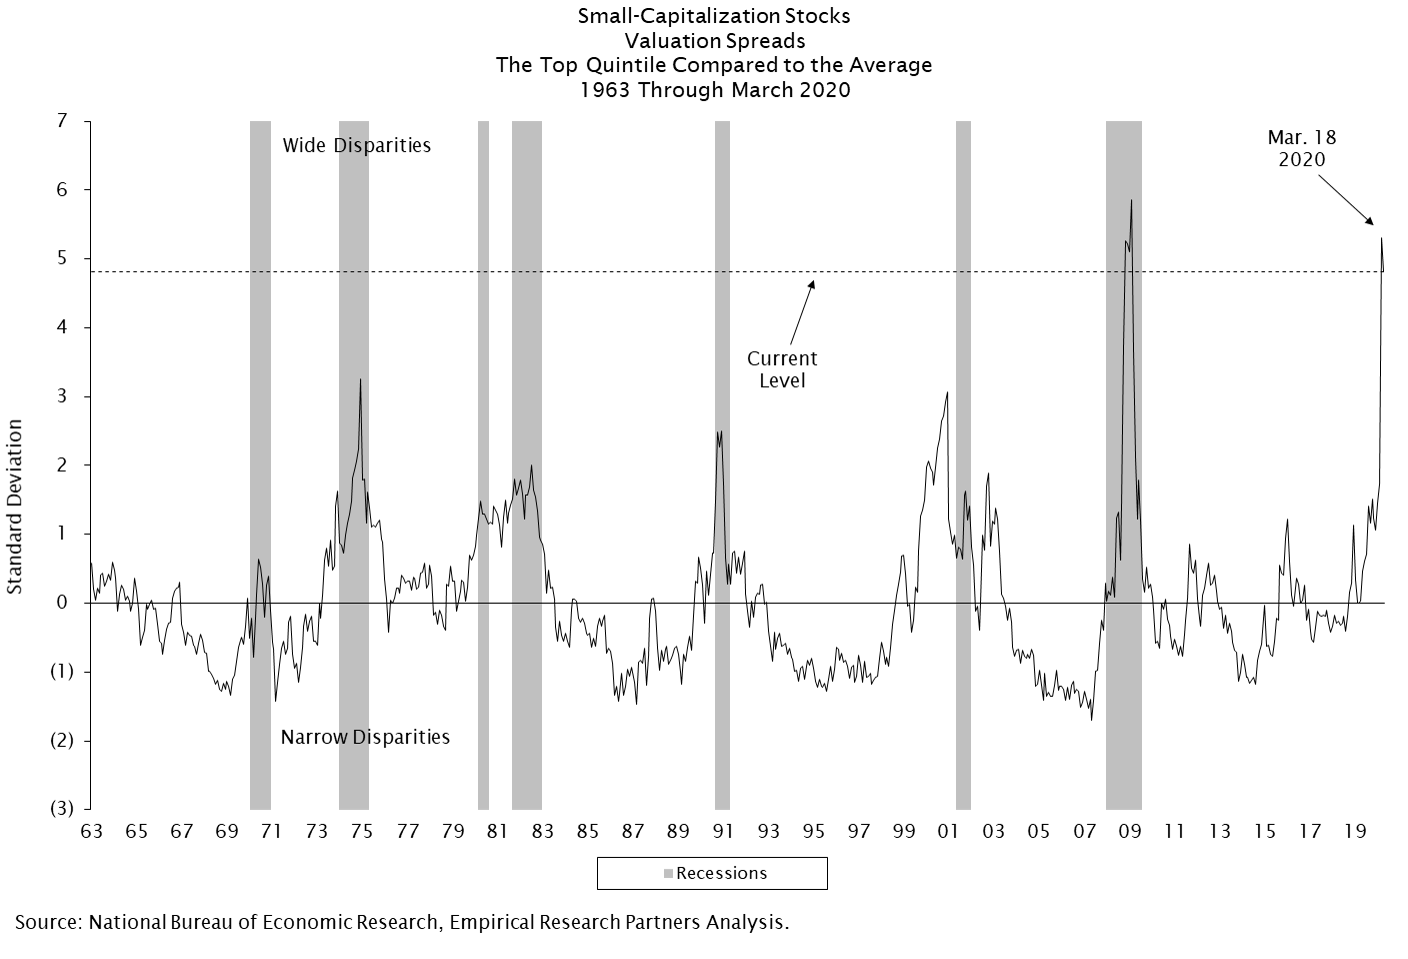
The rapid and steep economic slowdown is also expected by the marketplace to weigh heavily on small- to medium-sized businesses. The marketplace appears to have quickly priced in this risk as small cap valuation spreads have widened from less than 2 to 5 standard deviations (last seen at the extremes of the 2008-09 recession). As the chart highlights, over the past 60 years, there have been 5 other occurrences of significant widening of valuation spreads for small cap stocks: 1973-74, 1982, 1990-91, 2000-01 and 2008-09. Market dislocations like these have historically been followed with very attractive long-term returns. During the last three time periods (1990-91, 2000-01 and 2008-09), small cap value outperformed the overall market, generating 5-year annualized returns in the mid-teens to 20% level. While there are significant market fears, current valuations appear to be discounting a lot of this fear, providing long-term investors with a fertile ground to identify mispriced securities with significant upside potential and margin of safety. Current valuation spreads and absolute valuations would suggest that Value across all market caps have the potential to generate above-average market returns over the coming years, and not only warrant inclusion in asset allocation, but history would suggest now is the time for greater representation.
Our Deep Value Strategy significantly lagged the overall marketplace and S&P 1500 Value index during the quarter, down in excess of 40%. The portfolio experienced significant multiple compression, nearly 40% on various valuation measures. Historically, when our Deep Value Strategy underperforms due to significant multiple contraction it has generated investment returns in excess of 40% over the following 6 to 12 months.
During the quarter, we only had one holding Unisys (UIS), generate positive returns. Unisys successfully completed the sale of their Federal business for $1.2B in cash, a very accretive valuation level compared to the overall business (1.75x revenue and 13x EBITDA). Proceeds from the transaction are being used to retire outstanding unsecured debt and $600M will be deployed against pension obligations, allowing the U.S. pension to be more than 80% funded providing greater flexibility for future contributions. Unisys’s enterprise business remains attractively positioned and below normalized margins. Management is successfully growing the business and achieving its 12% long-term operating margin target over the next couple of years would support normalized earnings in excess of $2.50/share. Significant upside remains in the shares and we believe Unisys market price has the potential to exceed $25/share over the next couple of years.
Two of our largest detractors during the quarter were GameStop (GME) and BedBath & Beyond (BBBY). Both companies have new management teams that are undertaking turnarounds. In our last quarterly letter, we highlight some of the criteria we have found over the past 20 years that tend to lead to successful turnarounds. The marketplace sometimes forgets that a company is the legal entity that owns the assets and the business. In this instance, the COVID-19 outbreak is disrupting operations in the near-term, however both companies have strong balance sheets/liquidity, have temporarily adjusted their business models to reduce costs, and transitioned to generating revenue through on-line orders and curbside pick-up. In addition, both companies have significant assets that are not being reflected in the current depressed share prices. GameStop ended their fiscal year with nearly $500M in cash (>$7.50/share) and non-core assets (>1M square feet of real estate, corporate jet and Game Informer magazine) which could have considerable value if management decides to monetize these assets. During the past quarter, the business still generated a profit and book value grew sequentially for the first time since 2017 to $9.50/share. With the stock closing the quarter at $3.50, the marketplace is selling the stock based on its near-term view of the business alone. We have been increasing our position size over the past couple of weeks as we see a market price at a significant discount to its long-term fundamental value. BedBath & Beyond which is a little behind GameStop in their turnaround timeline also has a sizable asset base. The company ended their most recent quarter with $11/share in cash, and has significant non-core assets (real estate assets and non-core store banners which could bring more than $2/share in cash and further inventory monetization opportunities). While near-term business will remain challenged, we believe BedBath’s new CEO is focused on the right items to improve future store operations, reduce overall costs and enhance their omni-channel offering. With the stock price closing the quarter near $4/share (>60% discount to tangible book value) we see a growing price-to-value gap with substantial long-term share price upside potential and a significant margin of safety.
Finally, I’d like to highlight Pitney Bowes (PBI), a new holding that we have been scaling higher over the past quarter. Pitney Bowes is in its 100th year as a company providing commerce solutions that power billions of global transactions. Pitney Bowes provides e-commerce fulfillment, shipping and returns, cross-border e-commerce, office mailing and shipping, presort services and financial services to their customers. New management has made significant progress over the past two years in improving their balance sheet, reducing debt by >$1B and terming out maturities. Starting in 2012, the company built an extensive global e-commerce platform which was grown to $1B+ in revenue. During 2019, the company opened new distribution centers on the East and West coast. As the facilities reach capacity and redundancy costs in their infrastructure are eliminated, the division has the potential to expand margins over the next couple of years from break-even to 8-12%, nearly doubling the overall company earnings before income and taxes (EBIT). In addition, the company has excess corporate expense which provides significant cost reduction potential. Over the next couple of years, we believe Pitney Bowes has normalized earnings power in excess of $1.50/share and normalized free cash flow >$200M. While the business will have some challenges over the first half of the year due to the economic slowdown, we believe the current market price near $2/share reflects a lot of these near-term fears. Over the next couple of years, Pitney Bowes’s market price has significant upside potential as the current market price is at a normalized free cash flow (FCF) yield greater than 50% and less than 2x normalized earnings.
We appreciate your patience during these volatile times. It has been our experience that the recent negative price moves in our holdings is volatility and not permanent capital loss creating greater long-term return potential. We have stayed disciplined to our investment process and increased position sizes in holdings that we believe have the best long-term reward/risk opportunity set. With valuation spreads near historical extremes, we are very excited about the potential for our Deep Value Strategy over the coming years. As we mentioned in the past, our approach was a significant beneficiary of the outperformance of Value equities from 2000 to 2006. Early 2016 was also an attractive time for Value securities, as they led the marketplace over the following year and we generated returns in excess of 40%. As extremes were reached last year, we also saw significant outperformance with returns in excess of 60% from the lows in August. The names in the Deep Value portfolio ended the quarter nearly 60% below their 52-week high and at all-time low valuation levels (free cash flow yield >30%, earnings yield approaching 30% and a low single digit price to cash flow multiple). Our clients have the potential to benefit over the coming years from significant price gaps in our current holdings and the eventual narrowing of valuation spreads should provide wind at our backs.