
Deep Value Strategy 1Q 2023 Letter
Last year ended up being one of the strongest relative performance years for Value versus Growth since the popping of the Tech bubble in 2000, with Value outperforming by more than 20%. The marketplace broadened as the equal-weighted S&P 500 Index outperformed the S&P 500 market-cap-weighted index by the largest margin in the past 10 years. While low-valuation securities continued their strong start in 2023, that quickly changed in the month of March. The failure of Silicon Valley Bank and Signature Bank created stress in the banking system and increased overall market volatility. The fallout led to market concerns that quick moving uninsured deposits could leave other regional banks and create more liquidity issues. The stress on the banking system also led to growing recession fears as market participants worried about greater future economic headwinds from the ongoing rate hikes and tighter financial conditions.
The rapid interest rate hikes are now greater than any historical time period of a soft-landing, increasing marketplace probabilities of a recession over the coming year. Not surprising, “perceived” safe havens were in greater demand as the quarter progressed similarly to other historical time periods of increased market volatility. During March, interest rates quickly moved back under 4% as the market took a view that the rate hike cycle would soon be over, and, similar to the past, would be quickly followed by the lowering of rates later in the year.
For the first quarter, market participants crowded back into longer duration equities that have historically delivered stronger growth characteristics and benefitted from lower interest rates. As we have seen over the past couple of years, growing fears of a recession often leads to short-term volatility and a narrower marketplace. As the chart below highlights, the past 90 days had a very wide dispersion of returns across different subsets of the equity market. Technology dominated the Nasdaq Top 100 and Growth indexes significantly outperformed the S&P 500 while the Value universe lagged behind.
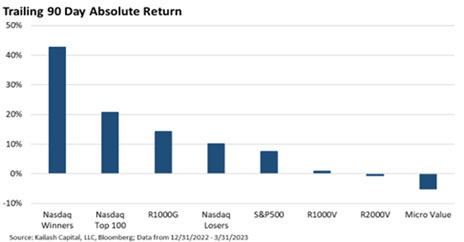
While 2022 benefitted from a broadening out of the market, the overall market still remains very concentrated versus history. The top 5 weightings of the S&P 500 Index, make up more than 21% of the overall Index (which is nearly 60% higher than their overall earnings contribution!). These 5 securities significantly outperformed the overall market and were in the top 7 of contributors of the S&P 500’s year-to-date return, generating 64% of the Index’s return in Q1! The same securities were also significant contributors to the Nasdaq Top 100 quarterly return of +20.8%. In fact, Kailash Concepts highlighted this quarter that the Nasdaq became very narrow, only 28 companies (Nasdaq winners) exceeded the Nasdaq Top 100 for the quarter, generating returns in excess of 40% to start the year (a significant portion of their return coming from valuation expansion). Kailash further cited how this significant narrowing of the Nasdaq market over 3 months has only happened one other time over the past 30+ years – August 31st of 2020 – as the longest duration equities significantly outperformed the overall market. During 2020, valuation spreads widened between the most expensive and least expensive portions of the equity market. The Nasdaq winners this past quarter also have a meaningful overlap with the longer duration portion of the equity market as their combined forward earnings at quarter end is less than 2%! The most expensive decile across various valuation measures was up double-digits to start the year, while and the least expensive posted negative returns. In some instances, a 20%+ difference between those two subsets!
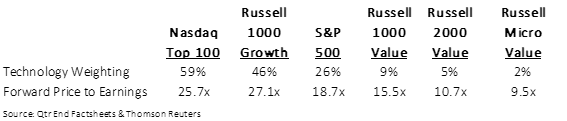
With the recent newfound interest in more growth-oriented areas of the market, it is not surprising to see the Technology sector also lead the S&P 500 to start the year. The S&P Technology sector generated returns of 21.8%, while the sector’s 2023 earnings estimates fell throughout the quarter, the quarterly return was generated from only valuation expansion. The S&P Tech price-to-earnings multiple expanded from 20.2x to 24.5x (ending the quarter 36% above its long-term average of 18x). Even with the recent Index rebalancing (reduction of Technology weighting) the strong outperformance quickly moved the sector back to 26% by quarter end. The chart below also further highlights how higher the valued Technology shares are influencing the valuation of various subsets of the equity market. These value Indexes currently have a much lower Technology representation (2-9% weighting) versus the much higher concentrated Growth Indexes (46-59%)!
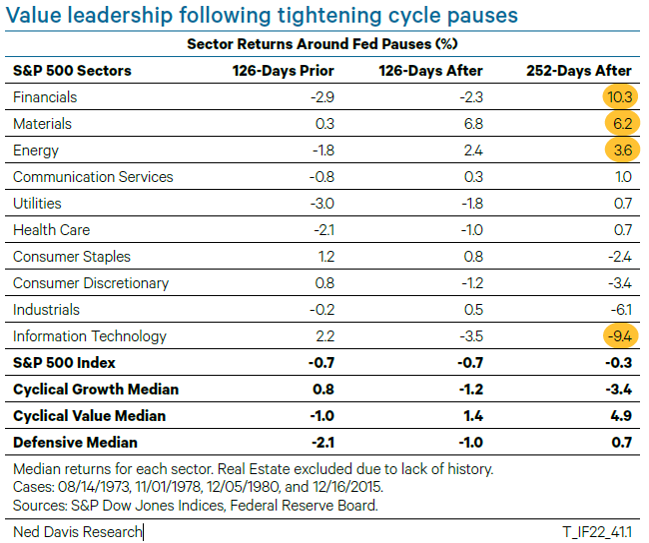
As we have seen in the past, longer duration equities may continue to do well over the coming months if recession fears remain elevated. However, when the marketplace becomes increasing crowded, we believe there is a greater likelihood of finding better reward/risk opportunities in the out of favor areas of the market. These unloved securities are currently seeing wider price-to-value gaps and appear to be discounting significant recession fears. Investors are being presented with a possible opportunity to take advantage of these short-term dislocations and potentially generate above market long-term returns from future valuation expansion and earnings and free cash flow returning to normalized levels. This is in stark contrast to longer-duration equities where valuation multiples are at a healthy premium to the overall market. While there are some great companies within the longer duration universe, future returns may become susceptible to any unexpected disappointment in future earnings/cash flow or growth expectations. Valuation which has been a nice recent contributor to performance could reverse course and become a detractor to future returns. NDR research, recently highlighted how various sectors performed historically following a Fed tightening cycle pause. The more value-oriented sectors (Financials, Materials and Energy) historically led the market 4 to 8 months following a pause, while Technology, eventually reversed its prior leadership and became the worst performing sector in the later time periods.
As the marketplace is forward-looking in nature, fears of a recession should eventually subside, and the market should refocus to potential future beneficiaries from an easing cycle and an economic recovery. During this time, the overall market should broaden out similar to last year. We believe low valuation securities and smaller market caps remain attractive at wide valuation discounts.
Small Caps Trading at Extreme Discounts versus Large Caps (0.7x) only seen once before during Tech Bubble
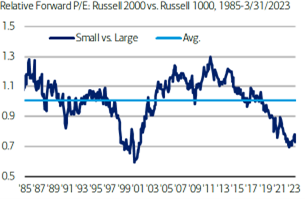
Small Cap Trading at Depressed Historical Valuations Relative to Large Cap
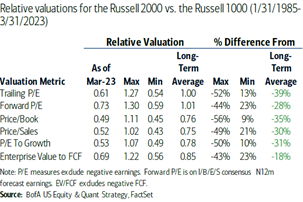
These securities have priced in a significant amount of recession fears (unlike the longest-duration equities today). While the near-term risk is ongoing volatility and further crowding, history suggests smaller-cap and Value equities will see attractive returns in the not-too-distant future.
Strategy Highlights
For the first quarter, the Deep Value Select strategy was down 3.6% net of fees, behind the overall market and the S&P 1500 Value Index. Value and cyclical stocks lagged the overall equity market during the quarter (specifically the month of March) which served as a headwind for the Deep Value Strategy short-term performance.
During the quarter, our largest positive contributor was M/I Homes (MHO), with share prices up in excess of 30%. Homebuilders in general had been under pressure for much of last year due to marketplace concerns on the potential impact from higher mortgage rates and lower housing affordability. However, as mortgage rates pull back the positive demographics and lack of housing supply over the past 10 years provides a very favorable long-term supply/demand picture for the industry that should shorten the current downturn. M/I Homes is nicely diversified covering multiple home-type categories, with properties in valuable local communities in the Midwest and Southeast (#2 in the Jon Burns Real Estate Consulting Submarket Desirability Index). M/I Homes’ attractive asset base, strong balance sheet and ongoing valuation discount to peers should provide an attractive long-term reward/risk investment opportunity.
Our two largest detractors during the quarter were Nabors (NBR) and Gannett (GCI), holdings whose share prices were down between 8 and 21% during the quarter. Both company’s shares appear significantly mispriced as they have multiple business segments embedded that are at deep valuation discounts to publicly traded peers or recent market transactions, providing long-term upside potential multiples of their current share price.
Nabors share price was negatively impacted from the recent pullback in energy prices. The company is well positioned to benefit from ongoing customer demand for their global high spec rig fleet. We believe the marketplace is overlooking the capital discipline within the industry over the past couple of years as the large domestic land drillers did not add incremental capacity. A favorable supply/demand environment should continue to be supportive of higher asset utilization, ongoing pricing power and attractive margins. Nabors’s International operations is also a market leader and well positioned to benefit from the upcoming ramp of their Saudi Aramco JV and the ongoing recovery in international drilling. Nabors has also been scaling up two newer efforts, their proprietary drilling solutions segment and new energy transition businesses. The new efforts combined have the potential to be a meaningful contribution to total company profitability over the next 5 years. With the new businesses having significantly lower capital intensity, Nabors’s business model should benefit from greater free cash flow conversion and reduced operational cyclicality overtime. We also believe the marketplace is underestimating Nabors’s significant ongoing debt reduction potential. Further reducing debt leverage to less than 1x has the potential to unlock significant equity value and help to narrow the greater than 60% valuation discount with its publicly traded peers.
Gannett’s transformation plan to transition from an analog to digital media company had some recent setbacks as the company experienced $100M+ of inflationary headwinds over the past year, adversely impacting company profitability. Management has taken quick action steps undertaking an aggressive $220M cost reduction program, looking to remove significant fixed costs from their business to enhance company profitability over the coming year. The long-term value creation of the transformation plan will continue to focus on scaling the company’s Business-to-Business digital marketing services (DMS) platform and Business-to-Consumer platform. The marketplace appears to be overlooking Gannett’s significant local, national, and UK audience reach, 179M monthly unique visitors. By expanding their digital offerings and developing new content partnerships Gannett has the potential to monetize their audience, developing new subscription revenue and cash flow streams. Similar to Nabors we believe the marketplace is underestimating Gannet’s free cash flow generation potential over the next couple of years as free cash flow conversion improves overtime and the company further monetizes non-core real estate assets. Ongoing debt reduction has the potential to unlock significant equity value. Finally, the company has internal businesses being overlooked by the marketplace when viewed versus recent market transactions or publicly traded peers. Gannett, whose current market cap ended the quarter below their normalized EBITDA, appears severely mispriced. As patient value investors we have time on our side and look forward to narrowing of the company’s wide price-to -value gap.
We believe the Deep Value Select strategy provides a distinct investment opportunity. The portfolio is highly differentiated from the overall market. We have concentrated investments in mispriced cyclicals and companies going through multi-year transformations. Our investment holdings tend to have a limited number of analysts following the company creating even greater marketplace inefficiencies. While the investments may require greater patience and a longer investment time horizon, with greater than 30% normalized earnings and free cash flow yields, current market prices appear to be at a fraction of their long-term fundamental value.
We thank our clients for their ongoing trust and will continue to work hard with the goal of generating attractive investment returns over the long term.
Deep Value Select Strategy Composite Performance (%)
| QTD | YTD | 1-Year | 3-Year | Since Inception (10/1/18) | |
|---|---|---|---|---|---|
| Deep Value Select Strategy (Gross of Fees) | -3.35 | -3.35 | -23.74 | 72.71 | 29.18 |
| Deep Value Select Strategy (Net of Fees) | -3.60 | -3.60 | -24.52 | 71.06 | 27.91 |
| S&P 1500 Value Index | 4.96 | 4.96 | -0.56 | 19.70 | 8.54 |