
Deep Value Strategies 3Q 2019 Letter
Rising global tensions, reoccurring recession fears, and interest rates that are close to 100-year lows have fueled a divide in the marketplace. Portions of the equity market appear to be discounting excessive optimism and others pessimism. The beneficiary of the environment over the past couple of years has been momentum/growth and low volatility securities and bonds. As we highlighted in our Q2 letter, there has been an increasing amount of crowding in these favored areas of the marketplace, while value equities and cyclicals have been severely overlooked by investors.
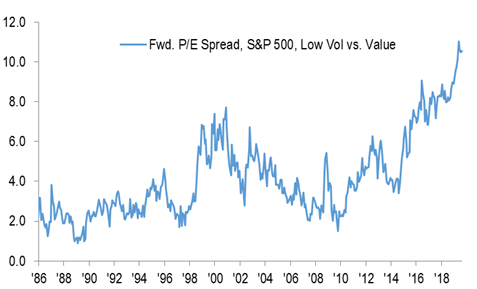
But just how unusual and extreme has the environment become? Valuation spreads between the most expensive and least expensive portions of the equity market approach levels last seen 20 years ago in the 1999/2000 time period. At the end of August, some of the dispersions approached four standard deviations! This is a pretty unusual occurrence that historically has been unsustainable for extended time periods, leading to a significant reversal over the following years. During the 1990s, the most expensive securities in the marketplace on a price-to-earnings multiple basis nearly doubled to close the decade near 60x. From 2000 to 2009, most securities within this subset reversed course, ending the decade below 30x. Over the past 10 years, we have seen a resurgence as P/E multiples for this group have again expanded; this time surpassing the 1999 peaks by more than 30%, recently in excess of 80x! The group of higher-priced securities appears to be already discounting significant future growth, providing investors an earnings yield below today’s anemic 10-year bond yield! Some suggest these trends will continue, supported by interest rates near all-time lows, however, similar to the past, we would not be surprised to see most unable to sustain these current lofty valuation levels as the long-term price-to-value relationship takes hold.
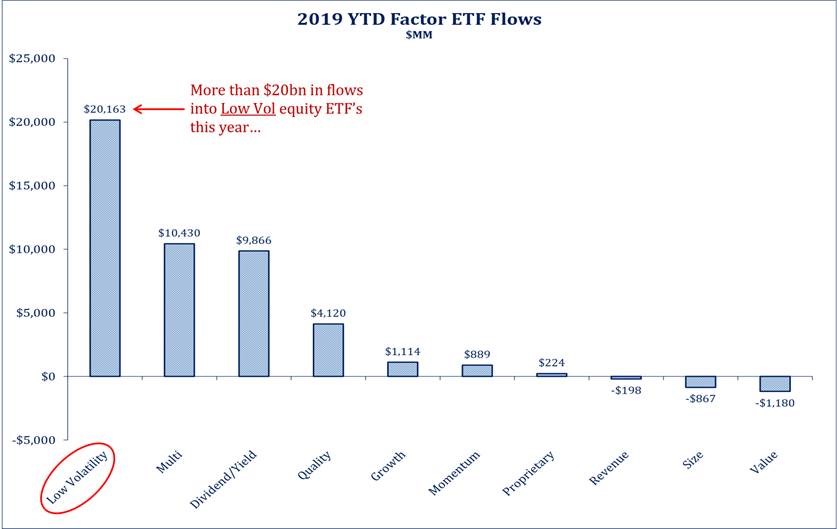
Equal to the favoring of growth and momentum securities has been the marketplace’s affinity for low volatility securities. With increasing economic and global uncertainty, the marketplace has crowded significant capital into lower volatility securities. Low volatility ETF flows have increased by more than $20B this year, nearly equal to the net gain of all other categories.
Similar to the valuation expansion seen in the most expensive securities, lower volatility securities valuation levels have also seen significant recent expansion. As the chart below highlights, low volatility P/E multiples relative to the market have increased over the past five years from parity to a 4-point premium, providing a 25% incremental return contribution. This occurrence is quite unusual as a significant portion of the low volatility universe consists of Utilities, Consumer Staples and REITS securities.
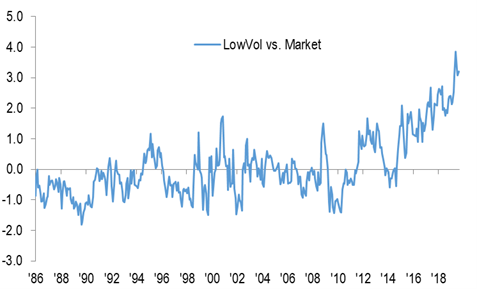
A majority of the constituents have significantly lower long-term earnings and cash flow growth prospects than the overall marketplace. Yet, low volatility securities today are at a significant valuation premium to the overall market and are approaching valuation levels that are on par with some growth stocks. It appears the market’s quest for higher income has coincided with rising economic fear causing an excessive premium for this perceived “safety” group. Similar to bonds, given current valuation levels we see less attractive future return potential for low volatility securities. In some cases, there is a growing risk that future returns could be negative if valuation multiples contract and overwhelm their income contribution.
While the marketplace has been cheering growth and low volatility securities, it has shown great disdain for the least expensive (value) securities in the marketplace. As value investors, we are attracted to the unloved, under-followed portion of the equity marketplace, where one is likely to find the greatest divergence between price and value. Many value securities’ market prices appear to be already discounting a lot of current market concerns, including a potential recession. But how inexpensive are Value stocks today? The price-to-earnings multiple for the value universe is in the low double digits, with the lowest valuation securities closer to 8x! The most expensive portion of the market has a P/E multiple that is 10x greater than the least expensive! As the chart below highlights, the price-to-earnings discount of value equities to the overall market is approaching 1999/2000 lows. When we have seen similar valuation spreads, future returns have been quite attractive for value securities, from 2000 to 2006 value significantly outperformed growth and the overall market.
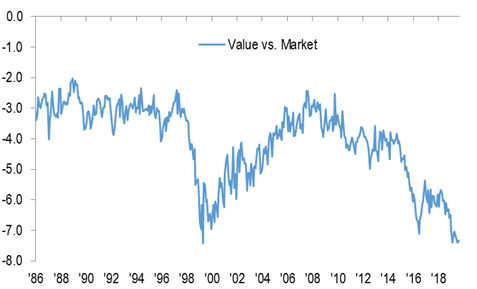
Our Deep Value and Concentrated Deep Value Strategies lagged the overall marketplace during the quarter, falling by 6.4% and 6.1% (net of fees) respectively. The significant underperformance occurred mostly in the month of August; as you can see in the charts above, value securities as a group dramatically underperformed the overall market.
During the quarter, we had a couple of holdings in both Strategies that saw double-digit price increases. Western Digital (WDC) (highlighted in our Q1 2019 Letter), Community Health Systems (CYH), Avon Products (AVP), Brighthouse Financial (BHF), Pitney Bowes (PBI), GNC Holdings (GNC), and William Lyons Homes (WLH) all were significant positive contributors during the quarter. Avon Products became one of our largest holdings at the end of last year as the share price pulled back near its all-time lows. Year-to-date, Avon’s share price has appreciated by 178%. During the quarter, we reduced our position size in Avon in favor of Nabors Industries (NBR). Similar to Avon late last year, Nabors recently returned to its recent price low last seen 30 years ago. Oil prices have recently been trending lower as the market fears a potential global recession could have a negative impact on future oil demand. As a result, there has been some near-term softening in the U.S. land rig market. We continue to believe Nabors is well positioned with a strong global customer base, a greater portion of automated rigs that are in high demand and an International business that is beginning to recover from a cyclical trough. Nabors’ normalized EBITDA over the next couple of years is still expected to approach $1B leading to free cash flow generation well in excess of $500M. With valuation near trough levels, price to cash flow <2x and a market price at a 65% discount to book value, we see the potential for significant future share price appreciation as the market begins to recognize the company’s significant asset base and future normalized earnings and cash flow power.
During the quarter, we increased our weighting in Tutor Perini (TPC) in our Deep Value Strategy as the stock price fell below $10 and initiated a position in our Concentrated Strategy. Tutor Perini is a leading global civil, building, and specialty construction company that provides general contracting and design-build services for some of the largest and most complex public/private projects. Tutor Perini share price has been recently under pressure due to a soft patch in business operations as older projects came to completion and new projects start dates were delayed. In our opinion, near-term results are well-below normalized levels, as the company has had great success in winning new contracts, growing its backlog to nearly $11.5B versus their current $4.5B annual revenue run rate. Their civil segment has been the largest beneficiary of new contract wins with greater than $6B in back-log. As the civil segment carries the highest company margins, in excess of 10%, we believe this new business wins with supported normalized earnings in excess of $3/share over the next couple of years. The company also anticipates the resolution of sizable outstanding receivables over the next couple of quarters. With a successful resolution on the outstanding receivables, Tutor Perini has the potential to generate more than $500M in free cash flow by 2021, allowing for significant debt reduction. At the end of the quarter, the company’s valuation multiples approached historical lows, EV/Revenue of .3x and 60% discount to book value. In our opinion, Tutor Perini’s share price looks significantly mispriced, providing a very attractive reward/risk opportunity.
Significant detractors during the quarter came mainly from our energy holdings, two generic company holdings, and some of our smaller cap holdings – all of which were near all-time low prices and valuation levels. Similar to prior time periods, we added to more than 70% of the laggards during the quarter, as we believe the falling market prices present even greater long-term return opportunities and deeper discounts to the company’s intrinsic value. Our energy holdings made up more than half of the quarter’s underperformance. The energy sector remains significantly out of favor, as it is near an all-time low weighting of the S&P 500. We find it interesting with all of the ongoing geopolitical uncertainty in the marketplace and a more balanced supply/demand environment that current energy prices lack any geopolitical risk premium. It is likely the fears of global recession adversely affecting demand are more than offsetting these potential risks. History would suggest it wouldn’t take a lot to change market perceptions over the next couple of years. Our energy holdings’ market prices, while weighing on near-term performance, remain at deep discounts to their asset values, and we see significant appreciation potential over the next couple of years even at current commodity prices.
Endo Pharmaceutical (ENDP) and Teva Pharmaceutical (TEVA) weighed about 2% during the quarter. We continue to see both companies making significant progress in their operational turnarounds and also moving closer to a potential settlement for opioid litigation. We believe a national settlement could be significantly less than what is currently discounted into each company’s market price.
During the past quarter, we also increased our position size in Bed Bath & Beyond (BBBY) as the stock fell below $8, a price last seen in 1997 when revenue was less than $1.5B versus the current $12B. We continue to believe the company presents a very attractive turnaround opportunity. The investment opportunity reminds us a lot of the story of Best Buy (BBY) back in 2011-13. Best Buy’s share price fell nearly 75% back then as the company saw a significant contraction in EBIT margins over a three year period. The marketplace questioned whether the company could compete versus Amazon. A new CEO was successful in stabilizing and improving profitability by undertaking extensive cost-cutting, removing non-core assets, rolling out new online features and implementing significant new supply chain initiatives. Best Buy’s stock price fell to nearly $10 in 2012 only to quickly recover to $40+ by the end of 2013 as signs of the turnaround were making progress. Bed Bath & Beyond has an extensive asset base with significant non-core assets that can be monetized (4.6m owned real estate, Cost Plus World Market, other smaller banners and Personalized Mall), $1B of excess inventory and more than $900M of cash (nearly $8/share) on the balance sheet. Over the past couple of years, nearly $1B has been spent on technology systems designed to enhance every part of the business. With EBIT margins near all-time lows, we see significant opportunity for margin expansion as the company right sizes SG&A, renegotiates 400 expiring leases and begins to roll-out significant new private label products to their store base. The company recently elected 11 new board members who collectively have significant turnaround experience. Over the past week, we were happy to see the company hire a permanent CEO, Mark Triton, the leading merchant at Target. Mark is a 30-year retail veteran and has been very successful at transforming Target’s operations by rolling out new private label initiatives that have been successful in driving accelerating sales trends. While it will likely take some time to see what kind of impact Mark will have on Bed Bath and Beyond, we believe management will continue to move at an accelerated pace and the current share price reflects limited future success in the company’s transformation. With a significant asset and revenues base, we see the potential for future normalized earnings and cash flow to be significantly higher than current levels. At quarter-end, the company’s share price was close to historical trough valuation levels, EV/Revenue <.2x, Price to Cash Flow less than 2x, and a greater than 20% earnings yield.
Coming out of the record valuation dispersions in 2000, value outperformed growth by more than 80% over the following six years. Our Deep Value Strategy significantly outperformed the market during this time period. While it’s difficult to know when the next favorable cycle for Value will begin, we have found wide valuation dispersions tend to be near inflection points. It’s also worth noting the significant reversal in the marketplace during September. Value performed well- close to +4% for the month. Our Deep Value Strategies also fared well during September, achieving double-digit returns. It has been our experience that the short-term negative price moves in some of our holdings is volatility and not permanent capital loss, which creates even greater long-term return potential as we take advantage by investing more in our greatest reward/risk names during the dips. As we look at the earnings yield of various subsets of the market, we can see significant dispersion. The Deep Value Strategies have a 19-23% earnings yield today, nearly twice the least-expensive quintile, 3x the S&P 500 and more than 10x the most expensive securities.
| Earnings Yield | ||
| Most Expensive Quintile | 1.3% | Near all-time lows |
| Low Volatility | 5% | Near historical lows |
| S&P 500 Index | 6% | |
| Least Expensive Quintile | 12% | |
| Deep Value Strategy | 19% | Near historical highs |
| Concentrated Deep Value Strategy | 23% | Near historical highs |
Since our holdings collectively tend to be below their average historical margins, normalized earnings yield looking out 2 to 4 years would likely lead to a normalized earnings yield for the Strategies that is significantly higher. The Deep Value Strategies holdings are collectively 43% and 53% below their 52-week highs while the market is not far from its all-time highs. Returning to their 52-week highs, the Deep Value Strategies would generate returns between 76-112%. Returning to historical average valuation for our holdings over the next couple of years would see the Strategies generate returns well in excess of 200%, which provides the basis for significant embedded return potential.
We appreciate our client’s patience during this recent period of underperformance. We also think new clients are getting an extraordinary opportunity to participate in very attractive future returns over the coming years. The Deep Value Strategies have always benefitted from the narrowing of valuation spreads within the equity market and given the current extreme levels last seen 20 years ago. We are confident the portfolios are well-positioned for significant future returns.
Daniel Lysik, CFA