
Dramatic movements in housing and financial markets over the past year have pundits asking if we are on the precipice of another systemic collapse tied to housing rolling over as monetary policy tightens at an unprecedented rate. The S&P 500 dropped 24.5% from its all-time high during the first six months of 2022, and most publicly traded securities lost value as correlations across asset classes spiked. The Barclays US Aggregate Bond Index lost 13.8% between August of 2021 and its June 2022 low, a “4-standard deviation event” for those that rely on historical price changes to construct portfolios. Credit spreads have widened, and options markets are pricing in continuing levels of high volatility.
Now, the Federal Open Market Committee has hiked the price of money at a rate not seen in four decades, which is combining with a surge in home prices to drastically reduce affordability. Buyers signing a mortgage today face a monthly payment 75% higher than what they would have paid for the same house a year ago. Since 87% of buyers finance their purchase with a mortgage, this is sending a chill across the housing market and only beginning to show up in the lagging data. According to Case-Shiller numbers, house prices in July dipped 0.3%, marking the first monthly decline in the index in over ten years. The last time the index declined was January of 2012, when the market was in its final throes of working through a glut of excess inventory tied to the global financial crisis.
The media and investors are understandably nervous, as home prices in the United States almost never decline; the last time they did, we all learned that the housing ecosystem and broader financial markets were ill-equipped to handle a drop in home values, given how rare and shallow previous declines had been. However, we believe the US’s set-up today is much more resilient than the one that precipitated the housing crisis fifteen years ago. There are several important differences:
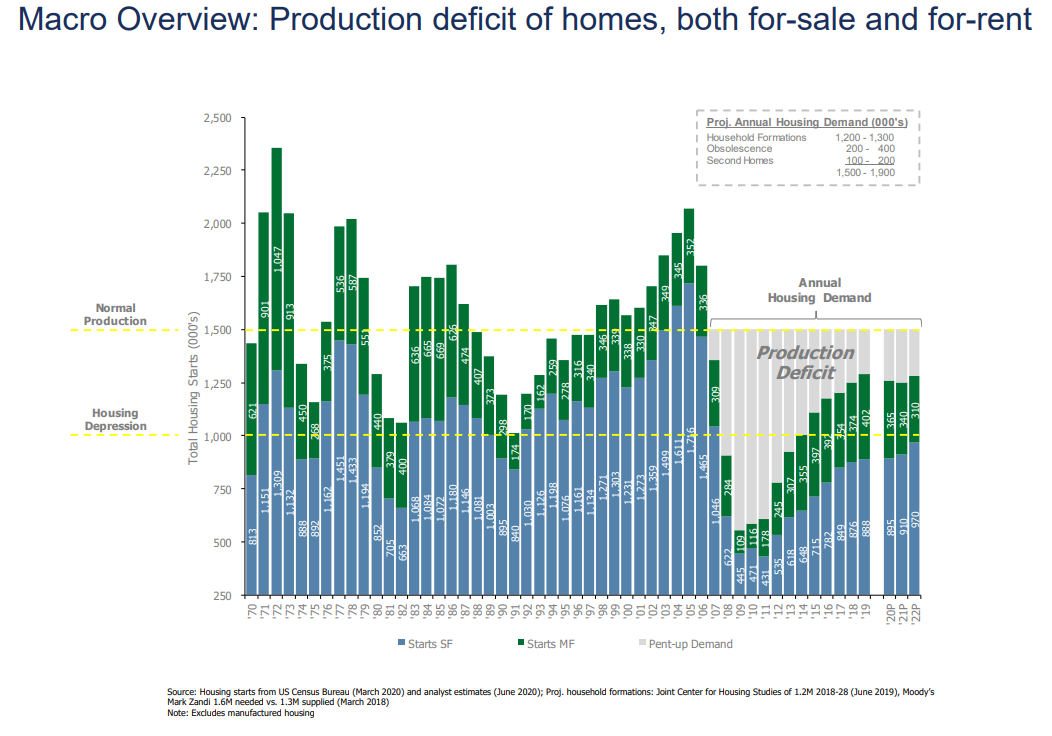
- The US Has Been Producing Less Homes than Needed Since the Crisis. While too much inventory precipitated the last crisis, we have too little supply today. Data from Lennar and other economists highlight that housing production continues to run well below household formations:
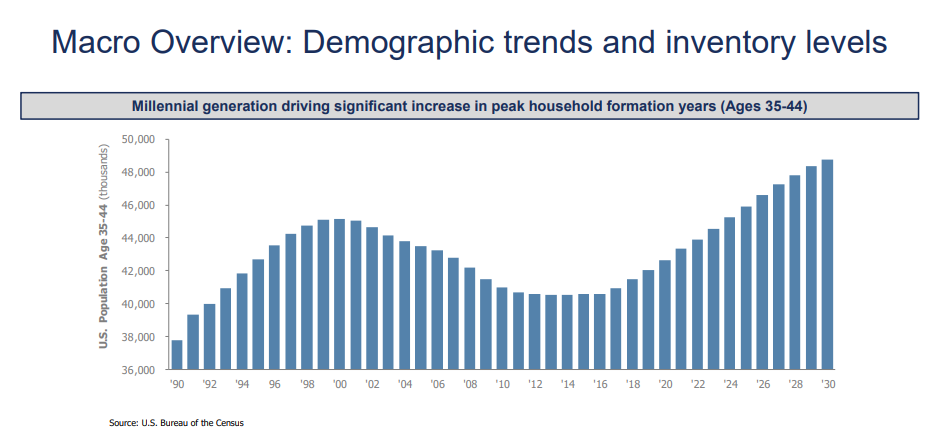
- The Number of People Hitting First-Time Homebuyer Age (35-44) Is Likely to Soon Eclipse Previous Highs. The millennial generation is hitting prime household formation age, pushing up the need for new houses at the margin. Prior to the crisis, the first-time homebuyer population had been falling for the better part of a decade.
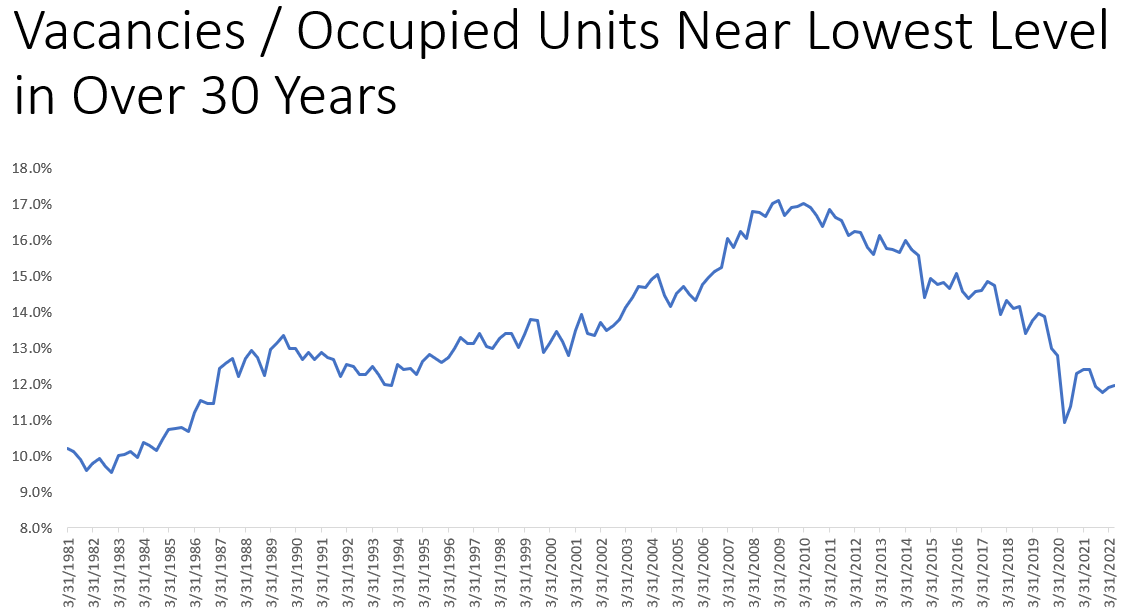
- Vacancies as Share of Housing Stock Near 30-Year Low. Houses are a bit like jobs, in that each is unique, it takes time to find the right one, and switching costs can be material. Each market requires a little bit of slack to function properly, and when there is not enough slack in either market, the primary adjustment mechanism is price. Today’s vacancies as a share of the total housing stock are about as low as we have seen in decades, while they were at an all-time high 15 years ago. The strong fundamental need for housing could limit price declines.
- High Level of Equity in Current Housing Stock. According to Black Knight, we are also looking at the most well-capitalized housing stock going back at least two decades, which should also limit the fallout tied to home price declines. Black Knight projects that a 15% housing price drop would leave just 3.7% of borrowers with negative equity, a fraction of the 28.2% of borrowers who had negative equity in the second quarter of 2011 after home prices declined by more than 25% peak to trough.
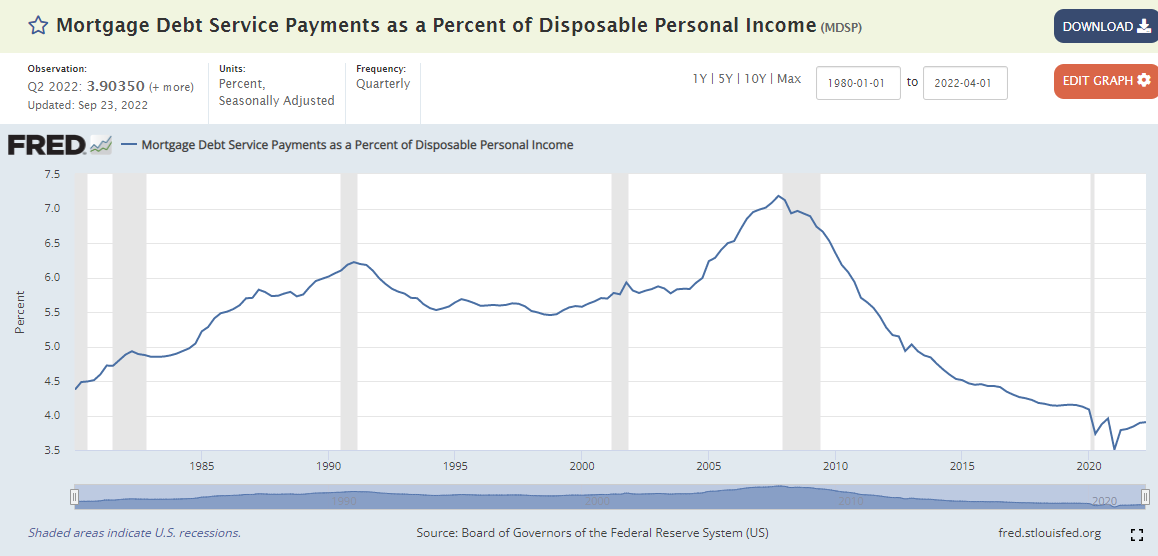
- Easier Payment Burden for Homeowners. Housing payments are a much less onerous share of consumers’ wallets today than they ever have been. According to data from the Federal Reserve, mortgage debt service payments are now near their lowest level ever as a share of consumers’ disposable income, which could mean that even if negative equity becomes an issue, borrowers could be less likely to default given how low the mortgage payment burden is today versus the past.
- Better Underwriting Standards and Banking System Capital. Much of the aforementioned robustness in today’s housing machine is tied to improved underwriting standards since the last crisis, as anyone who has borrowed under both lending regimes can attest. Data from the Federal Reserve also show that the US banking system ended 2021 at a 12.4% common equity tier 1 capital ratio, which is approximately 50% higher than it was prior to the global financial crisis. Even in what the Fed deems to be a “severely adverse” economic scenario with $600B in losses, the banking system’s capital would still be higher at its new trough than it was heading into the prior financial crisis.
While correlations have spiked and multiple asset classes have lost value as housing prices pull back, the fundamental backdrop does not suggest that another housing collapse is likely, at least in the United States, as the system is strong. None of this means that asset classes will stop losing value or that other factors will keep the global economy from worsening, of course, but prognosticators extrapolating a similar event to what happened in 2008 are probably barking up the wrong tree.
Bill Miller IV, CFA, CMT