
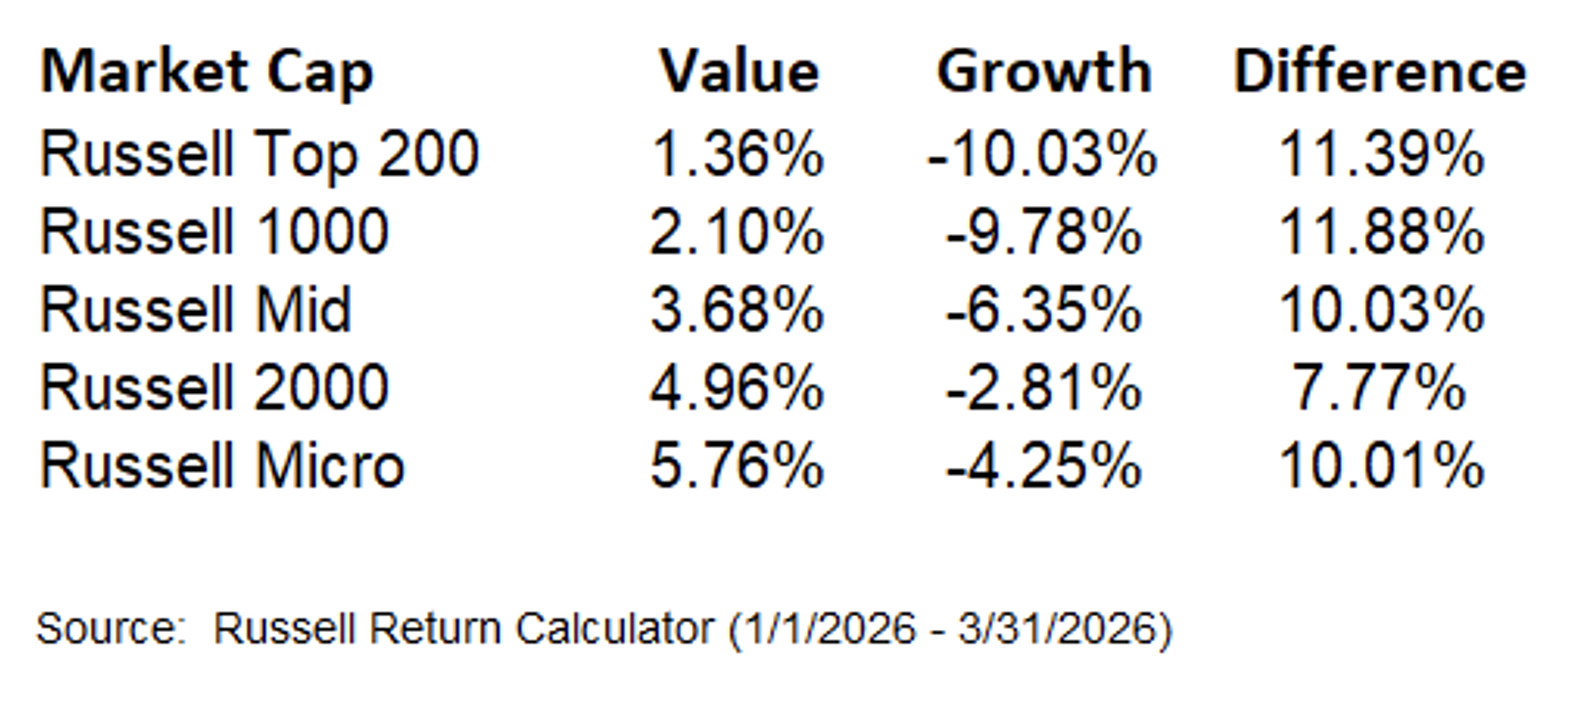
The year started with further market broadening, favoring lower valuation and smaller market capitalization equities. The Value outperformance cycle that began last year has largely gone unnoticed by market participants who remain overly focused on the popular AI and technology related companies. In our last quarterly letter, “Early Innings” we highlighted how value outperformed growth equities ~260–720 basis points across all market caps. In late February, the war in Iran began, causing an increase in energy prices, higher bond yields, and incremental market volatility. Unlike early 2025, value stocks generated attractive absolute returns and even greater relative returns. Value outperformed Growth by ~780–1200 bps across all market caps! Over the past two quarters, value stocks have outperformed growth by +1000–1780 bps, and small cap value has outperformed large cap growth by +1700 bps!
A permanent resolution to the war over the coming weeks would be a positive development for the equity markets. Investors may initially flock back to longer duration equities; the market expects high growth to continue. Investors should be aware that there are environmental factors that have shifted. We see a growing list of headwinds that may limit their future performance. Record concentration across passive and growth indexes have caused excessive crowding and traditional broader indexes to resemble growth indexes (level of concentration, elevated valuation multiples, and higher growth sector weightings). The recent challenges in private credit marketplace suggests to us over exposure to similar market themes in public and private investment vehicles and potential future liquidity risk for investors. And, the news cycle has been filled with the recent announcement of large AI partnerships, where suppliers, customers and investors are overlapping. The circular financial deals warrant caution in our view. We see these types of arrangements as a potential warning sign given a significantly greater interconnection with the leading companies in the sector. It is worth highlighting how similar financial arrangements were also prevalent in the Telecom and Tech sectors during the late 1990s. Finally, the large Hyperscalers recent shift from capital light to capital heavy business models could become a future headwind for cash generation and valuation multiples. The marketplace appears to beviewing the recent surge in capex favorably reflecting expectations of greater future revenue and free cash flow generation. However, with the growing need to spend to remain competitive, there is a growing risk of overspending which historically has at times been followed by excess supply, pricing/margin pressure, lower returns, and eventually financial strain for those who overextended their balance sheets.
Over the past couple of years, the market has rewarded longer duration equities with significant valuation expansion. While their long-term growth prospects are promising, elevated valuation multiples already discount uninterrupted, above-market growth well into the future. Any change to the rate of growth, timing, and/or future profitability may lead to significant divergences between expectations and actual future results. As we have seen in history, high valuation stocks that do not meet high market expectations can experience significant underperformance from a significant lowering of future market expectations and valuation contraction.
Kailash Capital has published extensive studies highlighting how high valuation stocks have consistently lagged the market over the long-term, including citing the famous quote by Scott McNealy, Co-founder of Sun Microsystems after the dot Com bubble burst.
“At 10 times revenues, to give you a 10-year payback, I have to pay you 100% of revenues for 10 straight years in dividends. That assumes I can get that by my shareholders. That assumes I have zero cost of goods sold, which is very hard for a computer company. That assumes zero expenses, which is really hard with 39,000 employees. That assumes I pay no taxes, which is very hard. And that assumes you pay no taxes on your dividends, which is kind of illegal. And that assumes with zero R&D for the next 10 years, I can maintain the current revenue run rate. Now, having done that, would any of you like to buy my stock at $64? Do you realize how ridiculous those basic assumptions are? You don’t need any transparency. You don’t need any footnotes. What were you thinking?”
Scott McNealy, Business Week, 2002
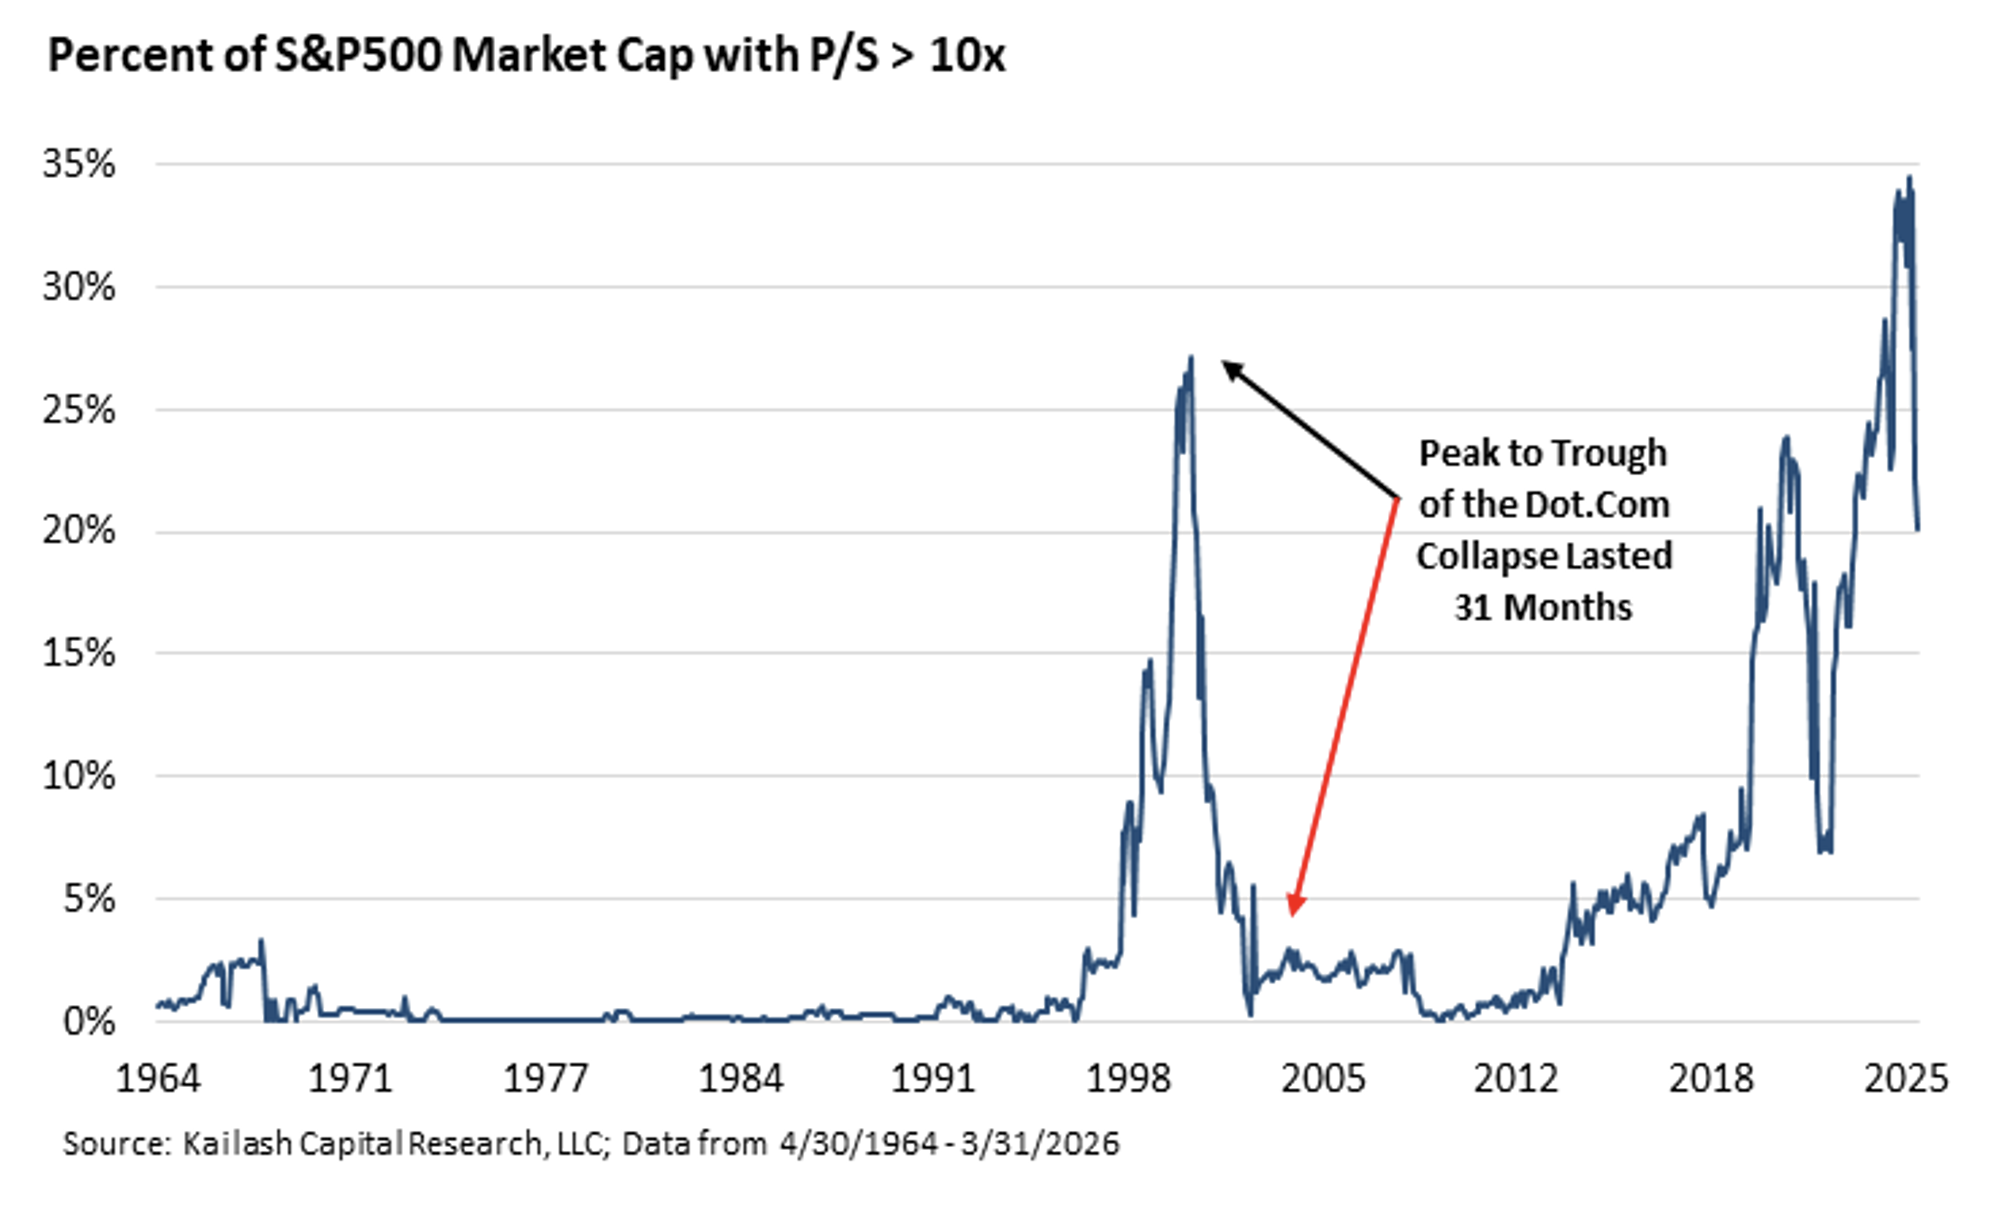
As we highlighted in our Q3 letter, “Low Valuation and Smaller Market Caps: A Timely Opportunity”, nearly 35% of the S&P 500 Index had a price to sales over 10x, an all-time high. As the chart below highlights, this expensive subset underperformed ending the quarter closer to 20%, however not far from early 2000 and 2022 peak levels. The Technology sector ended the first quarter with price to sales multiple above 8x, higher than the 7x peak in early 2000. Meanwhile, the Magnificent 7 ended the with a price to sales of 10.1x!
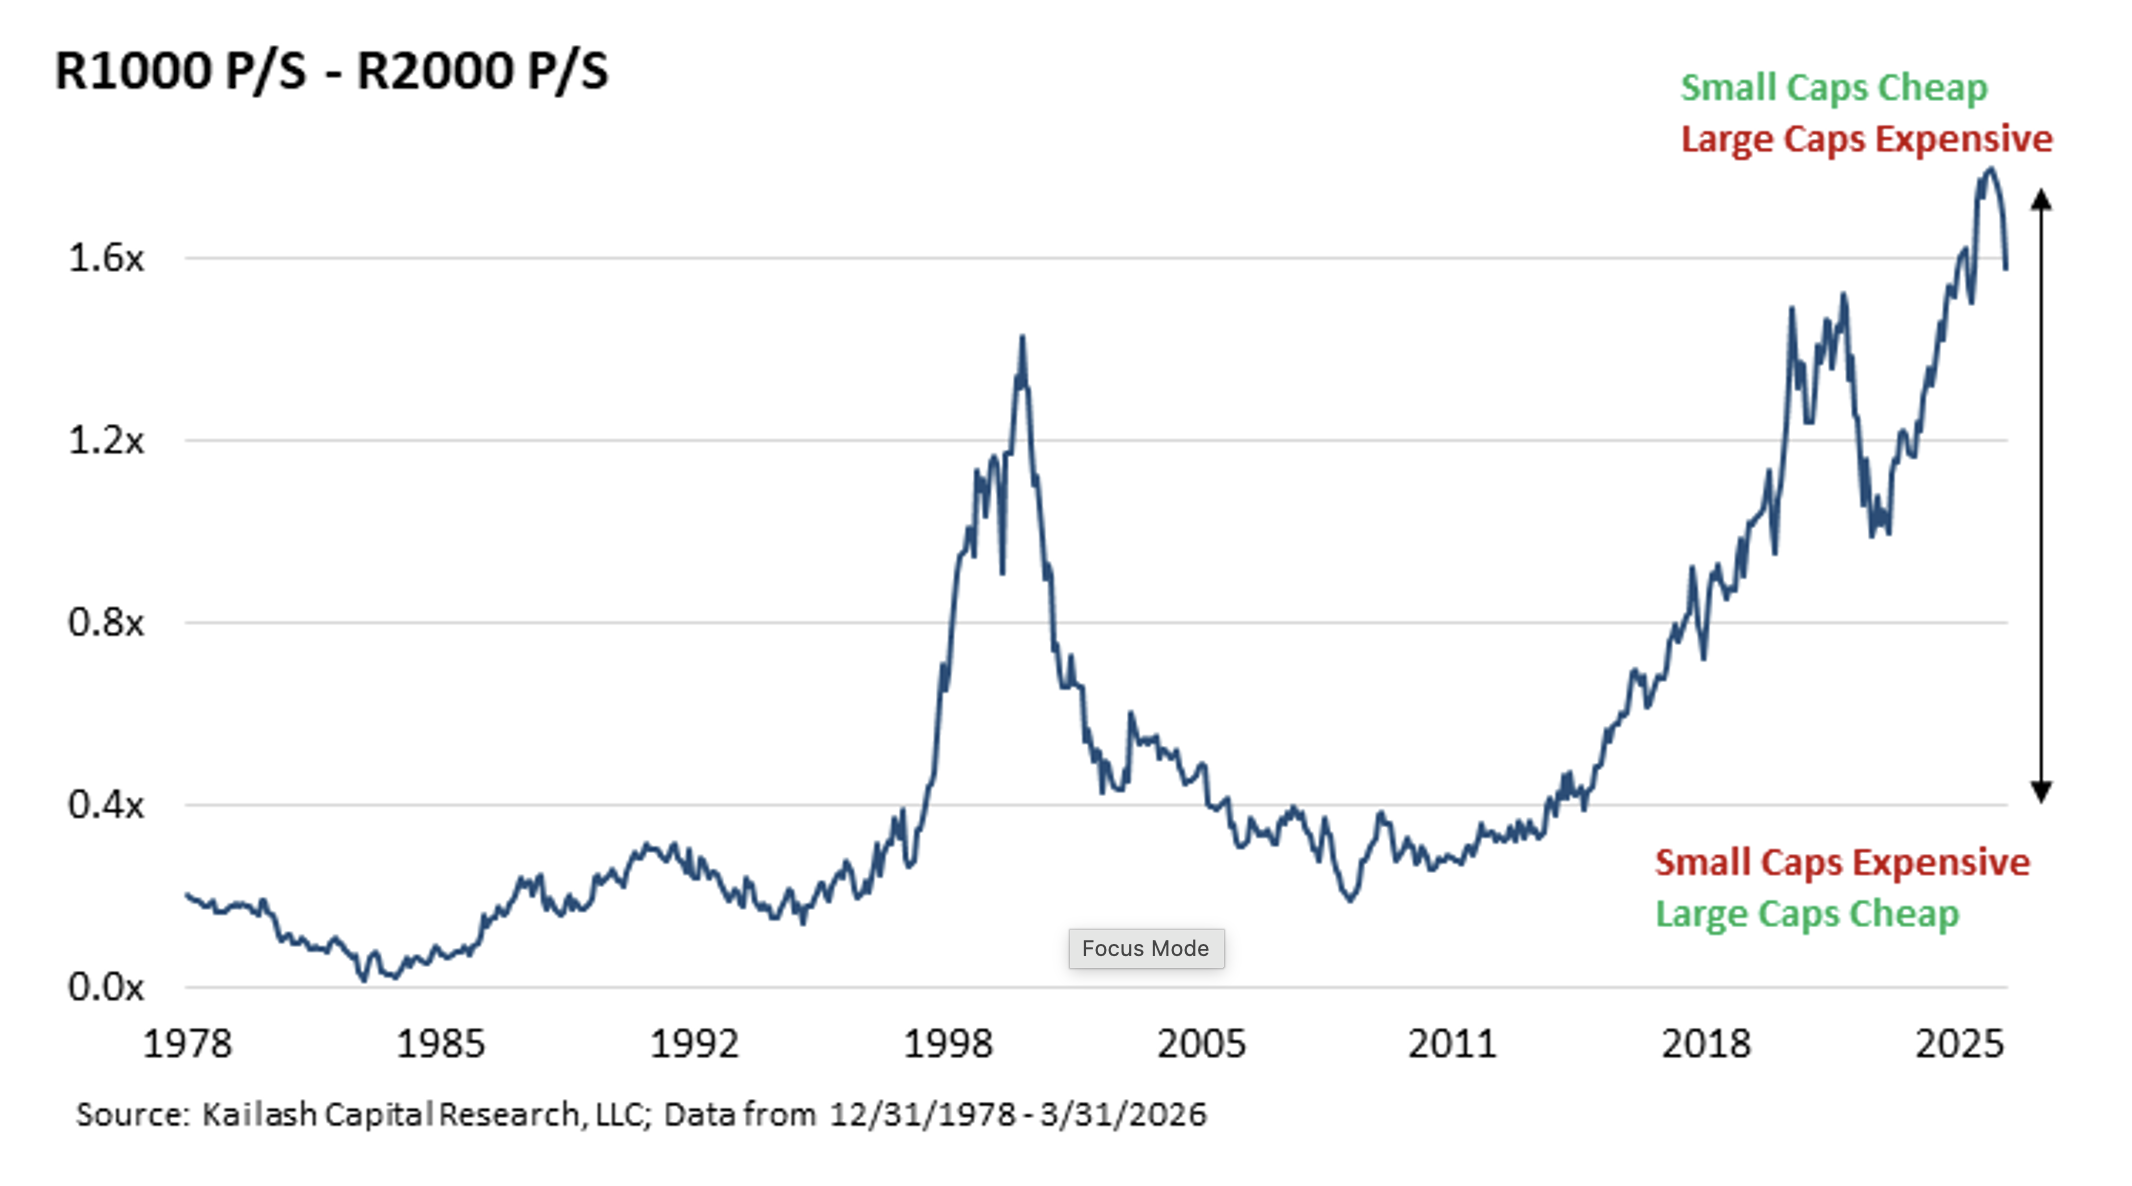
It has been a long 10+ year underperformance cycle for low valuation equities and small caps. The last cycle trough (early 2000) eventually ended as relative valuation multiples narrowed from historical extremes. The chart below highlights the relative price to sales multiple between large and small caps. At the end of 2025, the valuation spread reached a 50-year high, more than 4x higher than the start of the large cap performance cycle. However, even with the small cap outperformance in Q1, current levels are still well above prior peaks. Over the past couple of years, large caps have generated strong double-digit earnings growth as margins are approaching historical peak levels. The marketplace has rewarded their strong earnings with significant valuation expansion. The S&P 500 CAPE (“Cyclically Adjusted Price to Earnings”) multiple ended the quarter at 37.2x versus 30-year historical average of 28.7x. Meanwhile, small caps are coming out of a multi-year earnings recession. As small cap relative earnings growth continues to improve, we see this as a potential catalyst to narrow the large valuation gap between the two subsets over time.
There appears to be significant room for the market to continue to broaden out. The top 10% of stocks by size versus the entire U.S. stock market has had a median of 62%.
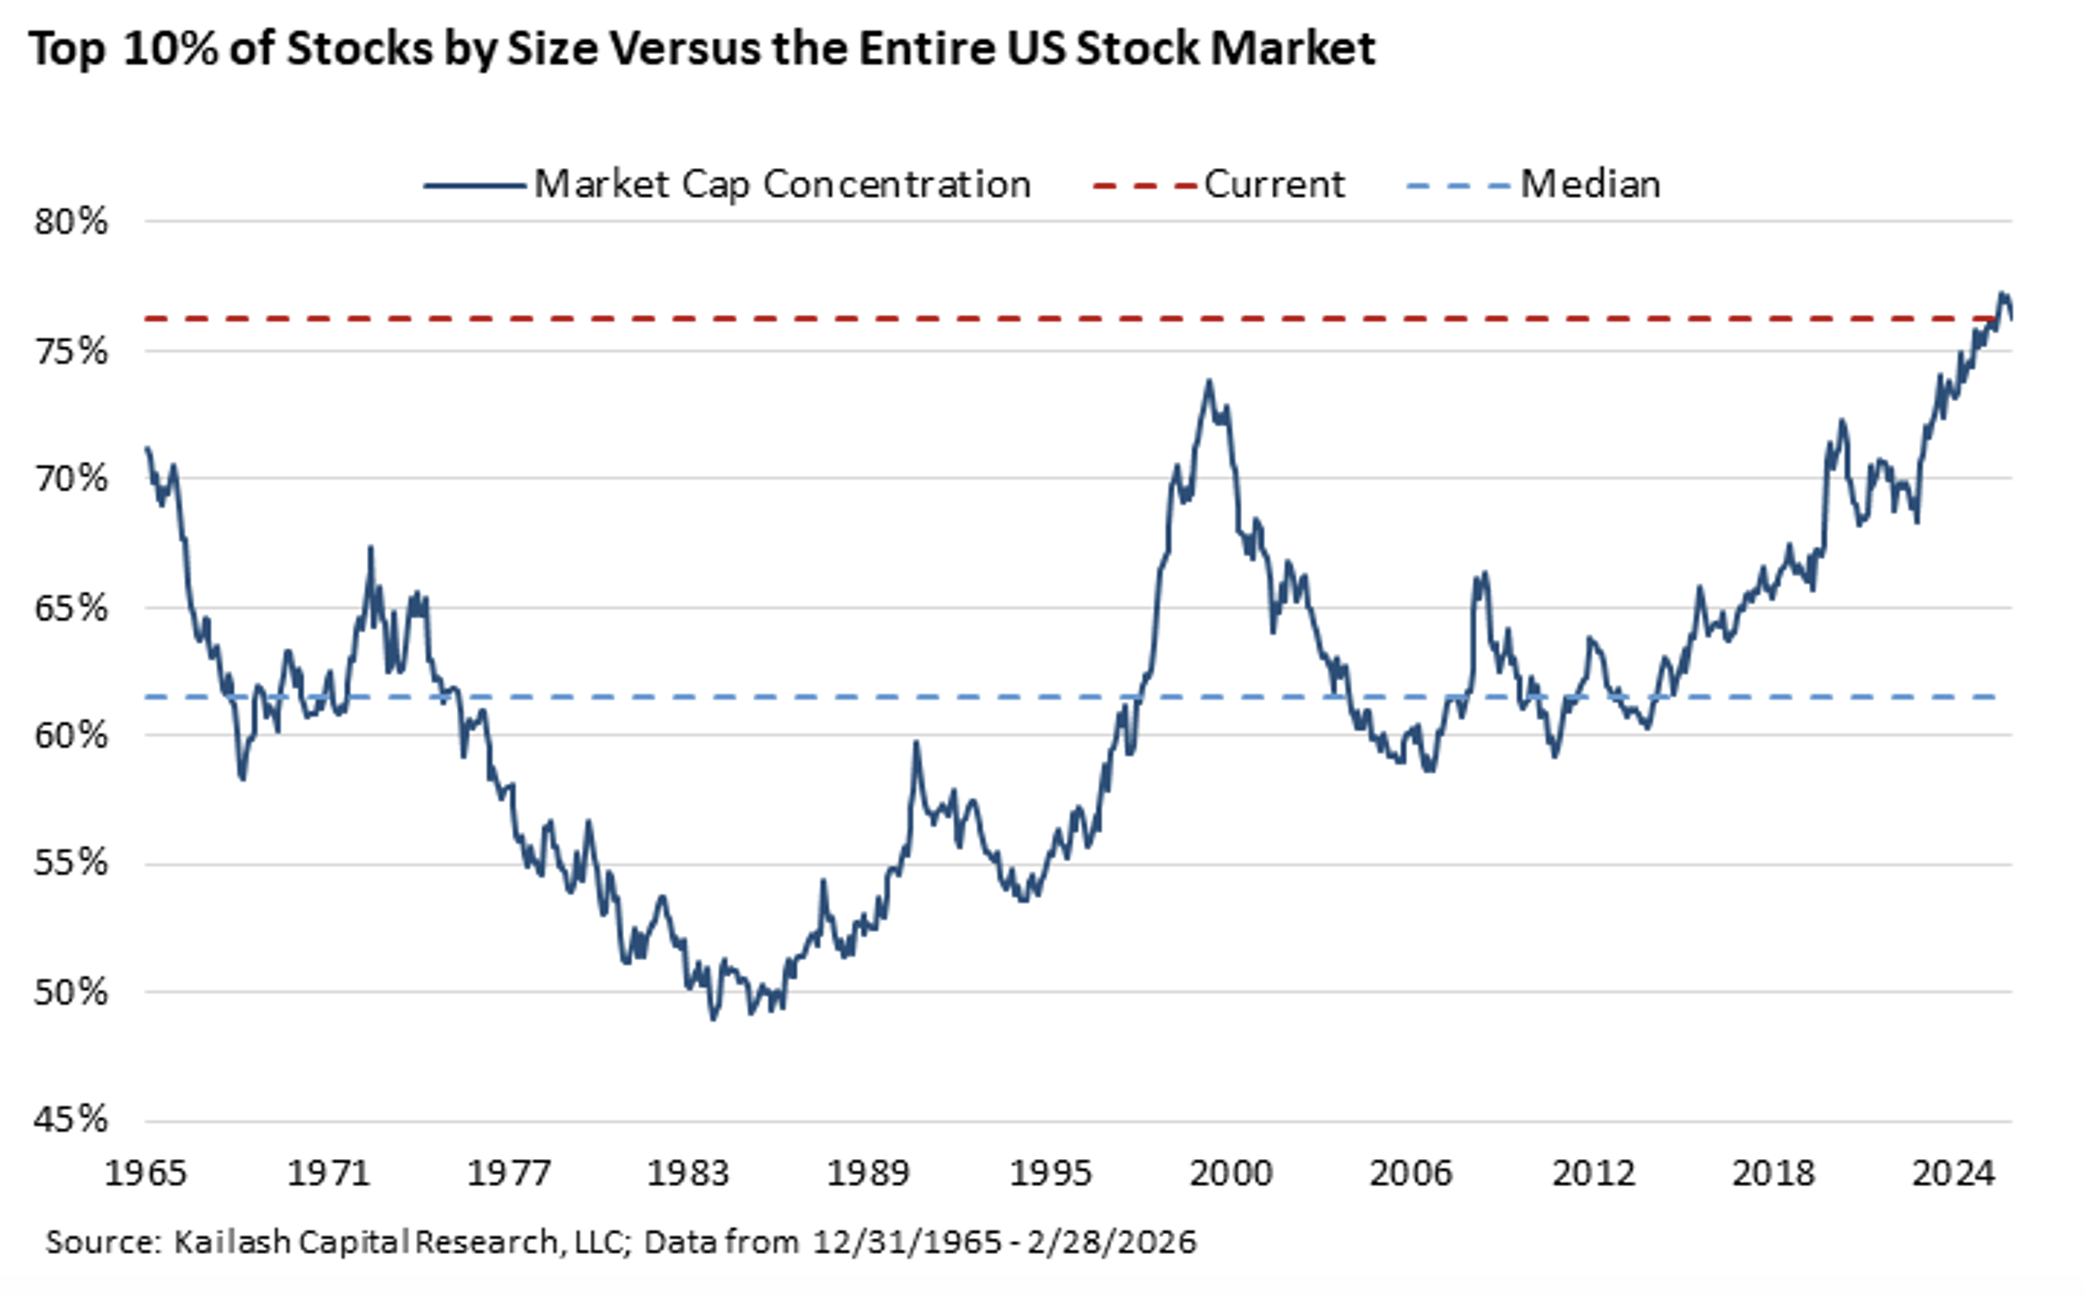
Today, it is at a record high, approaching 75%. With small caps only 3% of the equity market at the end of the first quarter, less than half of its long-term average, the market reallocating 3% weighting from large to small caps over the next couple of years would nearly double the small cap market representation and provide a nice tailwind for future returns. We continue to see attractive investment opportunities in lower valuation securities and smaller market caps, numerous companies with double-digit earnings and free cash flow yields. Although there can be no assurance, we are correct, in our view, we see conditions favoring a strong potentially multi-year outperformance cycle for low valuation and small caps!
Miller Deep Value Strategy Highlights
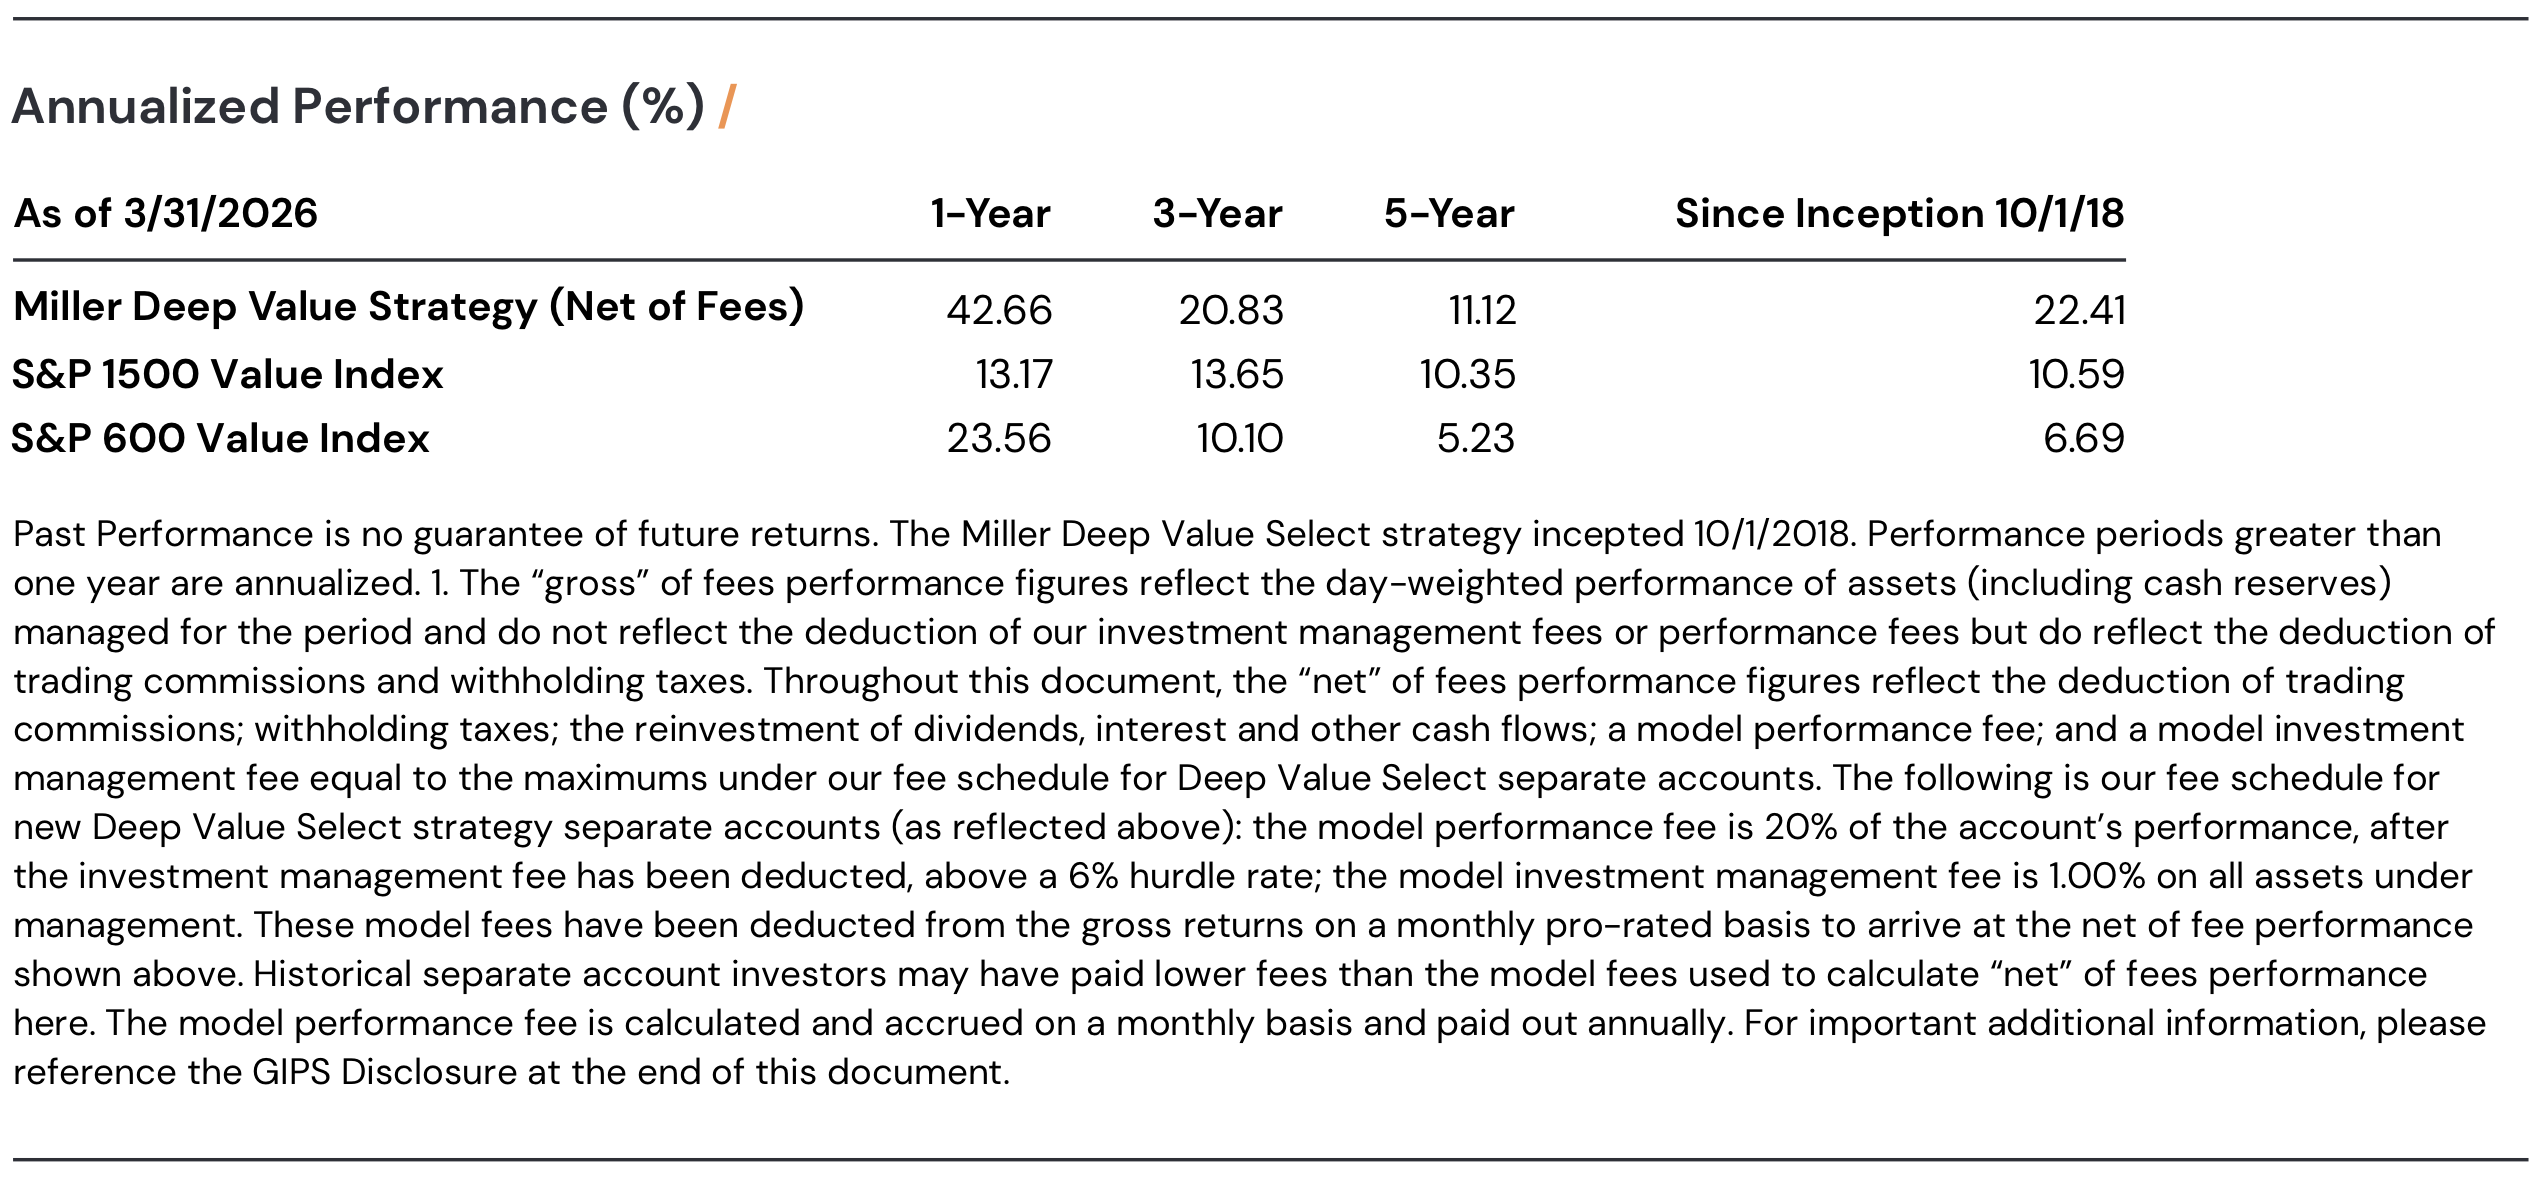
The strategy had a strong start to the year, Deep Value Select was +8.39% (net of fees), versus the S&P 1500 Value Index +0.19% and the S&P 600 Value Index at +4.32%. The strategy benefited from the ongoing rotation to small cap value stocks, holdings success with their transformation and our investments in the energy sector.
During the quarter, the largest positive contributor was Nabors Industries (NBR), which was up 58%. Nabors successfully completed the sale of their Quail Tools business segment, which significantly improved the company balance sheet. Nabors net debt leverage ended the year near 1.8x. Over the past 12 months the company has reduced total debt by more than $350M, eliminating all debt maturities before 2029. Nabors looks well positioned to benefit over the coming years from higher commodity prices, an eventual pick-up in North America rig demand, expansion of their low capital-intensive and higher margin drilling solutions and scaling their 50-rig program with SANAD. The company is also well positioned for any incremental global drilling. Nabors has been a long-term partner with leading Integrated Energy companies, historically having more than 10 rigs working in Venezuela. While Nabors has a sizable Middle East presence which poses some risk with the ongoing Iran conflict, to our knowledge the company has not reported material disruption to date. Near-term risks would also be unexpected return to lower commodity price environment which we believe is low given the ongoing industry supply challenges and a slower than expected recovery in N.A. rig market. Our view of Nabors’ long-term upside potential is still multiples of the current share price if the company executes on the factors discussed above, with the shares are still trading near 2x cash flow and more than 40% normalized free cash flow yield.
Our two largest detractors during the quarter were JELD-WEN (JELD) and Conduent (CNDT), which were down 49% and 33% during the quarter, respectively. Both companies’ share prices are at deep discounts to what we believe is their long-term fundamental value; we have recently increased our positions in both holdings.
JELD-WEN, is a leading North American and European manufacturer and distributor of interior and exterior doors and windows, undertaking a multi-year transformation. Their plan has similarities to Masonite’s successful transformation ten years ago. Late last year JELD-WEN hired a senior operational executive who was previously at Masonite that will help enhance the transformation plan. The company is undertaking a significant cost reduction program, reducing their North American headcount by more than 10%. In addition, management is phasing in price increases during the second quarter that should help offset inflation and tariff pressures and improve margins later in the year. The company has an extensive asset base (e.g., large real estate portfolio) which provides ongoing monetization opportunities and a margin of safety to the transformation plan. In addition, JELD-WEN North American distribution business is currently under review. Last year, Lowes paid 1.35x revenue to acquire distributor Foundation Building Materials, which in our view suggests the market may be undervaluing JELD-WEN’s distribution business relative to the current market cap. JELD-WEN also has leading market share positions in their European operation, which generates more than $1B in annual revenue. Their European business provides additional operational leverage to a housing recovery and potential monetization proceeds over time. We believe JELD-WEN current share price may reflect a fraction of its long-term fundamental value, with current market cap near $100M versus annual revenues >$3B, under 1x normalized free cash flow yield. With the housing and R&R (repair and restoration) market at an extended trough, near-term revenue headwinds may persist. However, we believe management is making the right enhancements to the business and believe further success on their multi-year transformation plan has the potential to unlock significant equity value over time.
Conduent delivers digital business solutions and services to 50% of Fortune 100 clients and 46 of 50 states. The company is in the midst of a multi-year transformation. During Q1, the company announced a new CEO, Harsha Agadi, with historical transformation success. Harsha plans on accelerating cost reductions, enhancing core client economics and new business pipeline conversion. He is looking for structural changes to enhance company free cash flow generation, using non-core asset sales and better cash generation to further accelerate future debt reduction. We also believe his incentives arealigned with the transformation plan with 1M shares that fully vest in three years subject to a share price in excess of $5/share. Success on the transformation supports Conduent revenues >$3B and double-digit EBITDA margins over time. Conduent has a sizable government business which could experience near-term disruption from additional government closings. In addition, with the recent management change there are some near-term risks that transformation plan changes will take some time to scale which could cause some short-term headwinds for profitability. However, we believe that current share price discounts this market fear. Conduent shares look significantly mispriced, less than 2x normalized EV/EBITDA, versus publicly traded peers at 8 to 10x.
Early in the quarter, we initiated a position in Crescent Energy (CRGY), a top 10 domestic Energy and Exploration (E&P) company. While a small market cap at time of purchase, Crescent’s significant asset base/free cash flow power should support a mid-cap market cap over time. Crescent’s share price was down 50% over the past year due to weak commodity prices and the completion of Vital Energy acquisition which brought debt leverage to the higher end of the company’s historical range (1.5x). Management has a successful track record of buying assets at a significant discount to their long-term value, improving acquired company operations, removing excess costs, driving down development costs, and enhancing well productivity. Vital brings Crescent into the Permian basin with low decline production 10+ year inventory. The company also recently hired an experienced operator who successfully built out Pioneer Natural Resources Permian Assets. Crescent’s asset base has significant flexibility to move within liquids (oil, gas, and NGL), focusing on best capital return potential and maximizing free cash flow over the cycle. Management has also successfully built a mineral asset and royalty business that generates $160M of EBITDA; current private and public transactions have been at 7-11x EBITDA multiples which in our view suggests significant $1-1.5B of underlying value. With acquisitions as a core part of the long-term strategy, there will always be risk of integration challenges. However, the company has been very successful in acquiring assets over the past 10 years and their underwriting is done with conservatism focusing on quick payback and accretion to free cash flow and NAV. With the recent increase in commodity prices and Vital merger synergies, the company may be positioned to deliver $1B+ in annual free cash flow over the next couple of years, although actual results may differ materially. In addition, any unexpected return to lower commodity price environment is an ongoing risk however we believe this is low given the ongoing industry supply challenges. In our view, Crescent shares remain very attractive near 2x cash flow and what we estimate to be a normalized earnings and free cash flow yield near 30%.
We also initiated a position in Bloomin Brands (BLMN), a company in the midst of a multi-year transformation. The company has $4B in revenue focused on the casual dining portion of the restaurant market. Bloomin Brands’ two largest banners – Outback and Carrabbas – are leading brands in the large steakhouse and Italian segments of the market. The company’s smaller growing brands are Bonefish Grille and Flemings. Two years ago, Starboard Value took a 9%+ equity stake, highlighting the parallels to their previous successful turnaround in a casual dining space. Darden Restaurants has a very similar portfolio of brands as Bloomin Brands (Longhorn Steakhouse, Olive Garden and Capital Grille). Darden’s former successful Chief Operating Officer has been a recent addition to the Bloomin Brands board. The company also hired a new CEO who has embraced Starboards turnaround plan focusing on improving the Outback banner, enhancing the company balance sheet, and reinvesting back into the asset base. The company has been investing in new systems and guest-facing technology to reduce check-out time and gather consumer feedback. Late last year, management rolled out a new steak line-up at Outback and is reporting better consumer feedback and an inflection in restaurant traffic. During the upcoming year, management is using productivity savings to reinvest back into the business with a focus on improving food quality, enhancing server experience, and rolling out new marketing. In addition, management is undertaking a remodel program focused on refreshing all Outback stores by the end of 2028. Success of the transformation plan could help to drive the restaurant banners back to consistent positive comps and lead to margin improvements over time. Today Bloomin Brands’ share price is 80% below their all-time high, as the company is near historical low EBITDA margins versus industry peers in the low to mid-teens. Near-term risk is ongoing revenue and margins headwinds from adverse weather and rising beef costs. Bloomin Brands low valuation appears to reflect these concerns and limited expectations on the success of the turnaround plan; forward EV/EBITDA is below 4x and price to earnings (FY2) is below 6x based on trough earnings expectations. Success on the transformation suggests normalized EBITDA at >$500M and, with only $60M of long-term maintenance capex, our view of normalized annual free cash flow is near the company current market cap. Bloomin Brands’ long-term potential upside could be multiples of the current share price.
We remain focused on identifying attractive turnaround situations, significantly mispriced cyclicals and companies going through multi-year transformations. Our holdings have severely depressed share prices, at a mere fraction of the company’s underlying asset base and business model (revenues generally $3B+). W. With concentrated holdings in companies with multiple value creating drivers we believe there is significant embedded long-term potential.
We thank our clients for their long-term partnership.
Dan Lysik, CFA
April 8, 2026
Stay connected with us for updates and insights. Subscribe.
Follow us here, here and here.