
Deep Value Strategy 4Q 2022 Letter
This past year was a challenging year on many fronts. The list of headwinds for the year was long; the main challenges centered on inflation rates well above the long-term average, the Federal Reserve playing catch-up by raising interest rates at the fastest pace in history, and high geopolitical risk with an ongoing war in Ukraine. With greater marketplace uncertainty, there was above average volatility and weak market returns across most asset classes. Looking at a 60/40 Portfolio, the S&P 500 Index and the 10-Year Treasury both posted double-digit negative returns for the year. Is this a rare occurrence? There have been 2 other occurrences, in 1931 and 1941, of historical negative returns for both, however double-digit negative returns have never happened in the same year looking back 90+ years.
This year starts with most of the same headwinds in place and recession fears running high, however, there is a silver lining for Value investors. Increased volatility leads to market dislocations and likely greater long-term value opportunities. The fourth quarter saw Value generate double-digit positive returns and 2022 ended up being one of its strongest relative performance years for Value versus Growth (more than +20%). While the overall marketplace remains very concentrated versus historical time periods, it continues to broaden out which favors lower valuation securities. In 2022, the equal weighted S&P 500 Index outperformed the S&P 500 market cap weighted Index by the largest margin in the past 10 years. The overall market structure remains very favorable and supportive of an ongoing pro Value cycle.
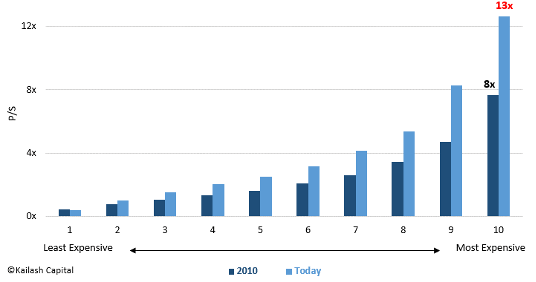
In our Q4 letter last year “Price Versus Value,” we highlighted how valuations spreads between the most and least expensive portions of the market ended the year near historically wide levels. With the Fed aggressively raising interest rates last year, there was significant valuation compression across the equity market, with the longest duration equities impacted the most. In the chart below by Kailash Capital, the most expensive decile saw its price-to-sales multiple compress from 25x to 13x!
Price-to-Sales Multiple by Decile: 2010 vs. Today
On the other end of the spectrum, the least expensive subset also saw meaningful valuation contraction, ending the year at a very wide discount to the overall market and is now the only decile below 2010 levels!
The valuation spread between the cheapest and most expensive deciles of the market remains very wide, well below historical averages of the past 60 years and close to all-time troughs of 2000 and 2020.
Cheapest Decile P/S Divided by Most Expensive Decile P/S
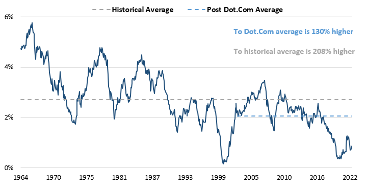
From the trough in 2000, Value stocks significantly outperformed the market over the following 6 years as valuations spreads narrowed between lower valuation stocks and the overall market. Even with the recent Value outperformance, there is still significant valuation spread narrowing that can further benefit low valuation securities over the coming years.
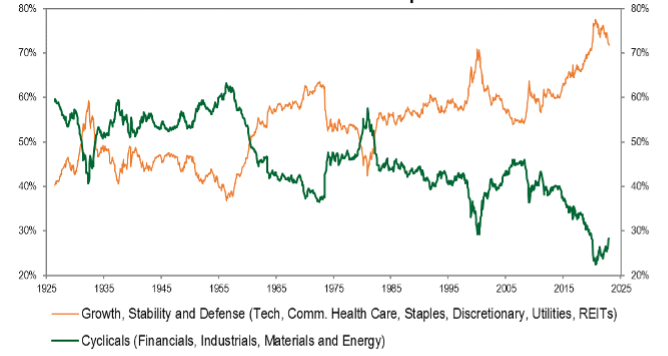
In terms of market composition, the S&P 500 cyclicals (Financials, Industrials, Energy and Materials) also remain close to a 100-year trough, having significantly fallen in weighting since 2015 as longer duration (Growth) valuation multiples expanded and significantly outperformed the market. The prior two significant troughs were during the 1973-74 (high 30s weighting) and 2000 (near 30%). Both previous time periods coincided with inflection periods for low valuation securities, leading to strong future returns. It’s important to note that from those two prior troughs the cyclicals representation in the S&P 500 Index increased by 1000-1500bps over the following 5 to 7 years.
S&P 500 Index Composition

Marketplace crowding and valuation expansion have been the main contributors to the wide dispersion over the past several years, similar to the late 1990s. However, over the past summer and early fall, rising fears of recession have caused the marketplace to also seek defensive and perceived “stable” equities, neglecting cyclical companies which remain at deep valuation discounts to the overall market.
During the fourth quarter, cyclical sectors were back in favor and the top performing sectors in the market posted double-digit returns. Value had a strong quarter outperforming Growth by more than 10%. Even with the strong close to the year, S&P 500’s cyclical weighting is still only 28.3%, suggesting further expansion potential over the coming years. Value Indexes still have much greater cyclical representation, more than 40%, significantly higher than the S&P 500 and Growth Indexes. One the largest differences in composition between Growth and Value Indexes are the Technology and Energy sector weightings. We continue to believe the market weightings are misaligned with the potential earnings contribution over the next couple of years, appearing to still favor greater Energy exposure. The Energy sector continues to recover from a multi-year cyclical trough and is still less than half of its 50-year average weighting of 11% in the S&P 500. With double-digit earnings and free cash flow yields, significantly improved balance sheets, and positive underlying supply/demand drivers, we see the likelihood that Energy securities can continue to perform well.
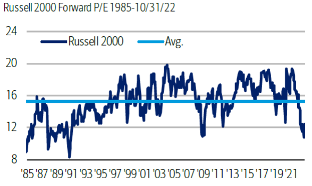
Finally, smaller market caps also appear extremely attractive versus the overall equity market. The charts below highlight the absolute price to the earnings multiple and relative price to earnings multiple of small capitalization stocks versus large capitalization stocks. Smaller caps are at 30 years+ extremes, already near deep recessionary lows!
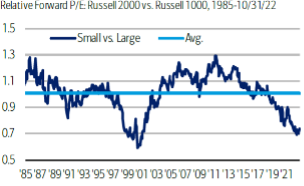
Given smaller market caps have a greater cyclical sector exposure versus larger market caps, it is not surprising to see valuation spreads widen when the market becomes more concerned about the potential impact of an upcoming recession. We believe small cap value stocks look very attractive and historically have also generated attractive returns during a pro Value cycle.
Where could we be wrong with our views? The Federal Reserve remains on an overly aggressive interest rate tightening path longer than current market expectations. Not deviating from its ongoing path as inflation moves lower increases the risk of creating an earnings recession greater than what is already discounted in the marketplace. Historically earnings recessions during higher inflation time periods have been much shallower than earnings recessions in lower inflation time periods. During the 1970s to early 1980s ,there were three earnings recessions that averaged -15% earnings trough. A higher inflation time-period initially supports a company’s revenues as they pass through price increases to help offset margin pressures. However, over time as demand falls, companies will find it more difficult to increase prices leading to margin/earnings contraction. During these time periods, cyclicals and smaller companies have historically outperformed the overall market.
While there are ongoing uncertainties as we enter the new year, we believe the environment remains favorable for Value and the market structure likely supports a positive multi-year Value cycle!
Strategy Highlights
For the fourth quarter, the Deep Value Select strategy was up more than 30%, well ahead of the overall market and the S&P 1500 Value Index. For the year, the Strategy was up 3-4% nicely ahead of the overall market and the S&P 1500 Value Index. Value and cyclical stocks led the equity market during the fourth quarter which was very favorable for the Deep Value Strategy.
During the quarter, nearly 70% of the Strategy holdings were up more than 20% net of fees. The two largest positive contributors were Nabors Industries (NBR) and Quad Graphics (QUAD), holdings that were up more than 50% net of fees. Nabors remains an attractive energy service public LBO with significant value un-lock potential from ongoing debt reduction. The company is well positioned to benefit from strong ongoing demand in their global high spec rig fleet. We believe the marketplace is overlooking the very positive supply/demand environment for the energy service sector leading to high asset utilization and significant pricing power. Nabors’s proprietary technology and efforts to scale up their energy transition efforts has the potential to create significant incremental value for the company that does not seem to be reflected in the current share price. We believe the company remains an extremely attractive reward/risk opportunity, closing the year at $3.00/share (pre reverse split) and is still at a greater than 60% valuation discount to peers, 2x cash flow, and normalized free cash flow yield near 40%.
Quad Graphics has a large integrated marketing solutions platform that we think remains underappreciated by the marketplace. The company is benefitting from ongoing new business wins and price increases that could lead to free cash flow more than $200M over the next 5 quarters, close to the company’s current market capitalization. With a $3B revenue base and EBITDA margins below normalized levels we see an opportunity for the company to further grow free cash flow per share over the coming years. Further de-levering of the balance sheet and ongoing share repurchase at less than 3x normalized EV/EBITDA have the potential to create very attractive long-term value for shareholders.
During the quarter we only had one detractor, Tupperware Brands (TUP) whose share price was down more than 30%. The company is in a midst of a multi-year transformation focused on enhancing their global direct selling business, expanding their omnichannel presence, exiting non-core assets, rolling out new product innovation and enhancing the company technology and supply chain. Tupperware’s revenues have been adversely impacted by significant market weakness in Europe and China along with the company experiencing weaker volumes from implementing recent price increases. Management has undertaken a $100M cost reduction program and with the recent price actions beginning to offset commodity price pressures, the company should see profitability and cash flow generation improve over the coming year. In addition, management continues to make incremental investments in the business to further expand their omni-channel efforts and modernize their infrastructure. While it will take longer for the company to complete the turnaround plan, we believe the current share price has limited value for successfully completing the transformation.
During the quarter, we initiated a new investment in M/I Homes (MHO), what we deem as a significantly misplaced homebuilder. M/I Homes’ share price is 40% below its recent highs, at valuation levels near/below 2008-09 and 2020 industry troughs. Homebuilders in general have been under pressure due to marketplace concerns on the potential impact from higher mortgage rates and lower housing affordability. However, we believe the positive demographics and lack of housing supply over the page 10 years provides a very favorable long-term supply/demand picture for the industry that should shorten the current downturn. M/I Homes is nicely diversified covering multiple home-type categories, with properties in valuable local communities in the Midwest and Southeast (#2 in the Jon Burns Real Estate Consulting Submarket Desirability Index). The company appears well positioned with a strong land portfolio and a backlog that remains higher than 2019 levels. M/I Homes also has a strong balance sheet, with net debt to capital near 25% and no debt maturities through 2028. With their strong backlog, management still sees potential for Return on Equity to remain above 20% which, if achieved, would lead to strong tangible book value growth over the next couple of years. With market expectations and valuation near historical troughs (EV/Revenue <.5x, EV/EBIT near 3x and deep discount to tangible book value), the share price is already discounting a deep and extended industry trough. M/I Homes’ attractive asset base, strong balance sheet and deep valuation discount to peers should provide an attractive long-term reward/risk investment opportunity.
While the Deep Value Select Strategy returns were well below the past couple of years, we are encouraged by fourth quarter performance. With the portfolio’s normalized earnings and free cash flow yield greater than 30%, we see significant embedded upside potential in the current portfolio holdings. Nearly 60% of the current portfolio holdings are new to the Strategy over the past two years. For holdings that have been in the Strategy for more than 2 years, they remain at valuation levels that are at deep discounts to peers and have long-term upside potential that is multiples of the current share price.
We believe the Deep Value Select Strategy provides a distinct investment opportunity. The portfolio is highly differentiated from the overall market which allows investors to take ownership in businesses that are priced in the market at what we see as a fraction of their long-term fundamental value. If history is a guide, the marketplace structure currently favors a multi-year cycle for Value stocks and the Deep Value Select Strategy’s significant exposure to cyclical and smaller cap companies appears well positioned to take advantage of these attractive price to value dislocations. The Strategy’s very high concentration and high active share has the potential to be very additive to a client’s overall asset allocation.
We thank our clients for their ongoing trust and patience during these volatile time periods. We will continue to work hard with the goal of generating attractive investment returns over the long term.
Deep Value Select Strategy Composite Performance (%)
| QTD | YTD | 1-Year | 3-Year | Since Inception (10/1/18) | |
|---|---|---|---|---|---|
| Deep Value Select Strategy (Gross of Fees) | 34.99 | 4.26 | 4.26 | 42.69 | 32.17 |
| Deep Value Select Strategy (Net of Fees) | 34.68 | 3.22 | 3.22 | 41.29 | 30.87 |
| S&P 1500 Value Index | 13.49 | -5.47 | -5.47 | 6.39 | 7.82 |