Deep Value Strategy 2Q 2024 Letter
The equity market narrow leadership continued in the second quarter, as most large cap indexes generated positive returns and smaller cap and lower valuation indexes lagged the overall market. Mega-caps and longer duration technology stocks sustained momentum as their stock prices today discount significant future growth.
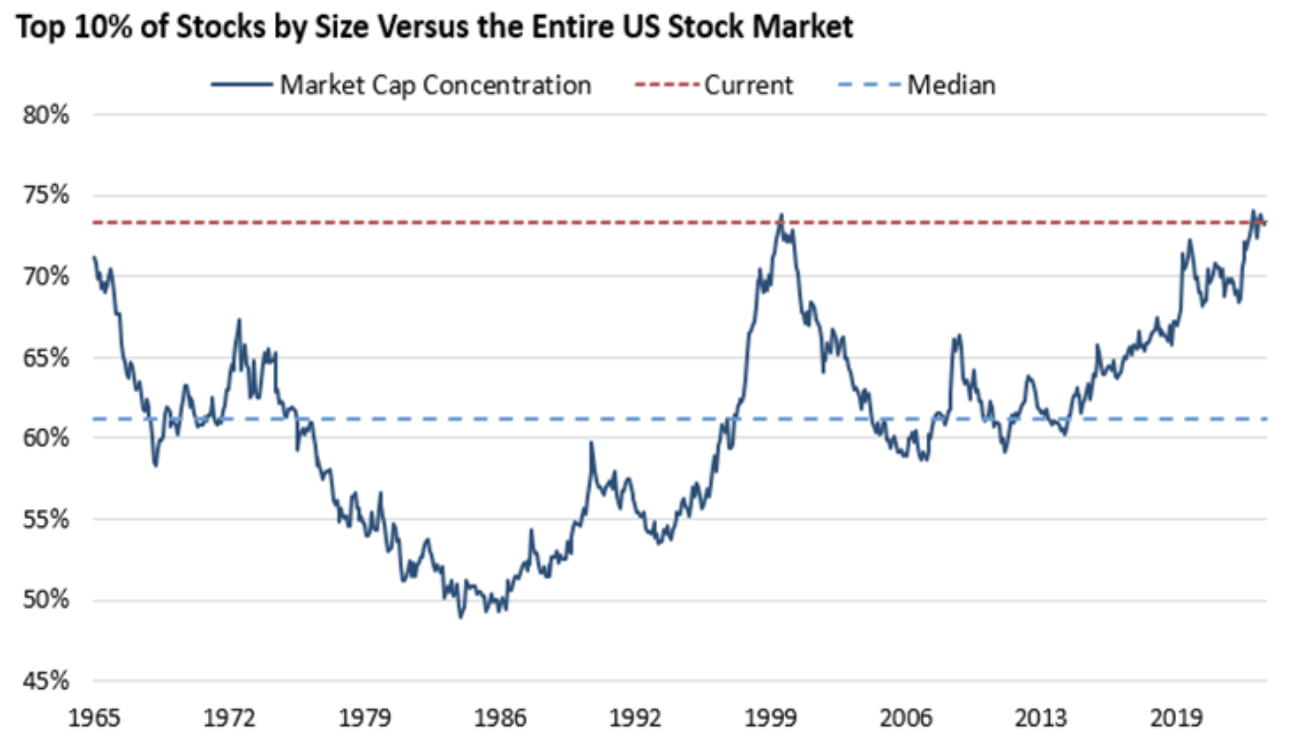
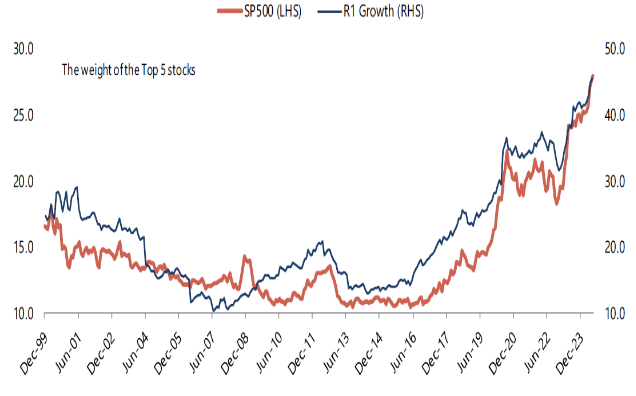
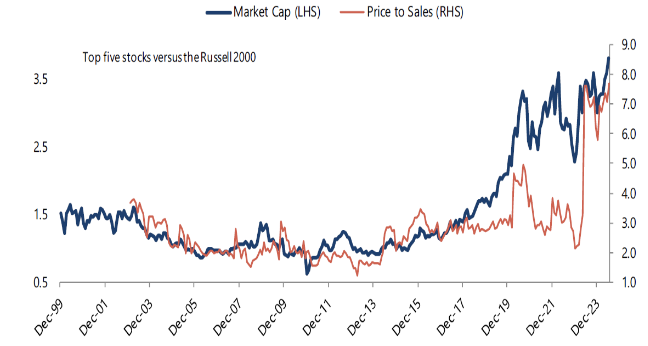
The top market caps of the S&P 500 Index are now well above Covid highs. The top 10% of stocks by size versus the entire U.S. stock market is near a 100-year high. Record concentration has supported strong returns for passive investing over the past couple of years, especially within the growth universe. The top 5 weighting of Russell 1000 Growth Index which was close to parity with the S&P 500 in 2016 is now nearly double the weighting, approaching 50% of the Index! As you can see in the chart below, the significant rise in market concentration has also been driven by longer duration equities as the price-to-sales multiple of the top 5 is nearly 4x higher than 2022 lows!
While market participants remain enamored with the top market cap companies, it’s worth mentioning that historically investing in the largest companies has consistently lagged the overall market over longer time-periods. When one looks closer at historical top 10 list by decade they will see significant changes overtime. A sure bet of one decade has historically not been the case looking out 10 to 20 years.
As we highlighted in recent letters, the crowding in Technology stocks has pushed up their representation in growth indexes and has further expanded valuation multiples. Valuation spreads within the equity market are approaching levels during the Covid time-period. The S&P 500 Technology sector weighting ended the quarter at 32% of the Index, with a forward price-to-earnings multiple of 30.4x (69% above its 20-year average of 18x), price-to-sales above 9x and 30x cash flow. While some Technology companies will be beneficiaries of greater AI adoption, the significant valuation expansion over the past year appears to be discounting strong growth well into the future. As we witnessed in the late 1990s, irrational exuberance can continue for an extended period, but fundamentals must continue to meet lofty market expectations or there’s an increased likelihood of greater mean reversion.
As Value investors, we are more attracted to neglected and under-followed parts of the marketplace, where market expectations remain extremely low. With a keen focus on the price versus value relationship, we look to identify investment opportunities where the price to value gap is wide. Stock prices, or small ownership stakes, at a deep discount to business value provide investors the potential for attractive future returns. Today, the lowest valuation subset of the market has an earnings yield that is multiples higher than the most expensive (closer to 2%, which is significantly less attractive when compared to a 5%+ risk-free rate). While long duration equities have benefitted from significant recent valuation expansion, low valuation securities may have more attractive valuation expansion potential today. A mispriced company with a price-to-earnings (P/E) multiple of 5 times can generate a 20% return for only one price-to-earnings multiple point expansion. To generate a similar return for a company with a P/E multiple of 40 times requires eight multiple points of expansion. Not only does it get harder to generate above market returns when valuation multiples are well above the average stock in the marketplace, history has demonstrated that the penalty for market disappointment goes up as well. A company with elevated valuation multiples and near peak margins can see a significant adverse price reaction for not meeting elevated market expectations. Lower future earnings expectations and valuation compression can be severe headwinds to longer duration equity future performance.
As the valuation chart below highlights, small caps also remain significantly out of favor. The earnings recession over the past year has been a significant headwind to 2023 and YTD performance. We see a nice opportunity for small cap earnings to reaccelerate over the coming 6 to 18 months. In addition, their relative valuation multiples have been reset to lows last seen in the market bifurcation of the late 1990s. Small caps have also been a historical beneficiary of a steepening of the yield curve. The yield curve has been inverted for nearly 2 years; an eventual steepening could provide a nice tailwind for small cap equities future performance.


While long duration and mega cap outperformance may continue in the near-term, the level of outperformance is likely to lessen overtime. During the first half of 2024, large cap stocks outperformed small caps by +12.5%, the 6th largest spread looking back 100 years. Looking at the 10 greatest historical starts for large caps, on average the baton was passed to small cap equities over the remainder of the year. In those years, on average small caps generated +14.3% in the second half of the year (+19.9% excluding 1929). With small caps now less than 4% of the total equity market (last seen in the 1930s), a small reallocation from longer duration equities and mega caps could provide a nice tailwind to future returns. As the market broadens out over time, high active share strategies with greater exposure to low valuation equities and small caps have the potential to provide an investor with attractive returns and a greater margin of safety. With the many mispriced opportunities within the small cap universe today, the Deep Value Select strategy has an abundant number of potential investment candidates. Through our deep fundamental research, we remain confident in our ability to make new concentrated investments to drive the strategy’s long-term performance.
Strategy Highlights
The Miller Deep Value Select strategy had a good quarter with composite net returns greater than 12%, well ahead of the returns of the S&P 1500 Value Index at -2.25% and the S&P 600 Value Index at -4.85%. Year-to-date, Miller Deep Value Select is up close to 15% (net of fees), ahead of the S&P 1500 Value Index’s 5.17% return and the S&P 600 Value Index’s -4.72% return. Miller Deep Value Select’s recent performance has benefitted from its very high active share (in the high 90%). We make investments in severely discounted business value and concentrate the weights to improve the return potential. We can take a longer view than most market participants and be patient to realize the value gained as significant discounts narrow over time. We only add new strategy investments we think have the potential to more than double in price looking out 5 years which is aligned with the strategy’s focus on generating attractive long-term returns.
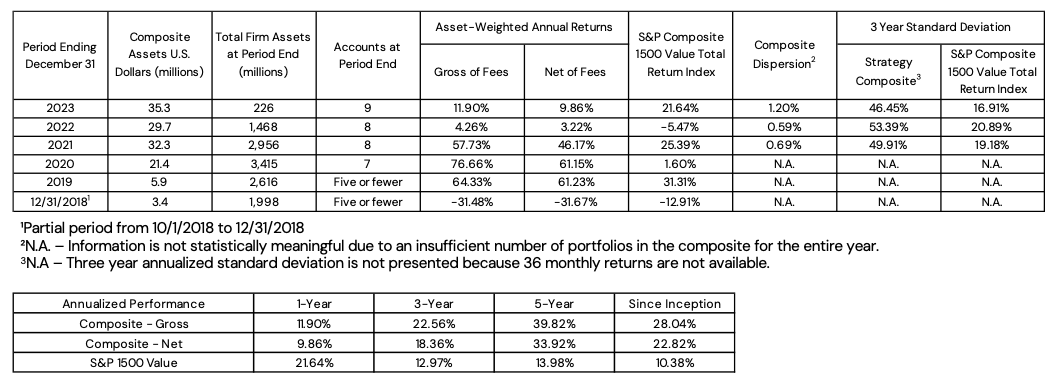
Deep Value Select Strategy Composite Performance (%) as of 6/30/24
| QTD | YTD | 1-Year | 3-Year | 5-Year | Since Inception (10/1/18) | |
| Deep Value Select Strategy (Net of Fees) | 12.84% | 14.85% | 34.22% | 2.61% | 32.30% | 23.59% |
| S&P 1500 Value Index | -2.25% | 5.17% | 14.56% | 9.00% | 11.65% | 10.40% |
Past Performance is no guarantee of future returns. The Miller Deep Value Select strategy incepted 10/1/2018. Performance periods greater than one year are annualized. The “gross” of fees performance figures reflect the day-weighted performance of assets (including cash reserves) managed for the period and do not reflect the deduction of our investment management fees or performance fees but do reflect the deduction of trading commissions and withholding taxes. Throughout this document, the “net” of fees performance figures reflect the deduction of trading commissions; withholding taxes; the reinvestment of dividends, interest and other cash flows; a model performance fee; and a model investment management fee equal to the maximums under our fee schedule for Deep Value Select separate accounts. The following is our fee schedule for new Deep Value Select strategy separate accounts (as reflected above): the model performance fee is 20% of the account’s performance, after the investment management fee has been deducted, above a 6% hurdle rate; the model investment management fee is 1.00% on all assets under management. These model fees have been deducted from the gross returns on a monthly pro-rated basis to arrive at the net of fee performance shown above. Historical separate account investors may have paid lower fees than the model fees used to calculate “net” of fees performance here. The model performance fee is calculated and accrued on a monthly basis and paid out annually. For important performance information, please reference the Deep Value Select GIPS Composite Disclosure.
During the quarter, the largest positive contributor was also our largest holding Gannett (GCI), whose share price was up 87%. Gannett had a favorable earnings report highlighting accelerated progress with their long-term transformation to a digital media company. Digital revenues (subscriptions, advertising, media services and partnerships) are expected to have a combined growth rate of 10%+ over the next couple of years as Gannett focuses on monetizing there 187M monthly audience reach. Total digital revenues have increased to 42% of total company revenue; as it approaches 50% of total company revenue, it will be able to fully offset the secular headwinds of the traditional newspaper business returning Gannett to company-wide revenue growth. It’s also worth noting that on a combined basis digital revenues have higher margins and will provide a mix shift benefit to corporate margins and free cash flow generation overtime. New York Times (NYT) went through a similar digital transformation 10 years ago and saw significant revaluation of the company equity. New York Times had a price to sales of .5x and EV/EBITDA under 5x at the beginning of their transformation which has expanded to 3.4x and 19x today. We think Gannett shares remain significantly mispriced at only .25x revenue and >40% normalized free cash flow yield. Gannett free cash flow is expected to have a 40% CAGR growth rate the next couple of years. Along with additional non-core asset sales, the company has the potential for $500M+ of debt reduction to further unlock equity value overtime. In addition, Gannett’s anti-trust suit versus Google is very similar to the DOJ anti-trust suit against the company. With the DOJ case going to trial this fall, a successful outcome could lead to potential future award for Gannett more than $1B, which would accelerate their transformation and accrue significant value to Gannett shareholders. We believe the current share price reflects limited value for long-term successful transformation plan and anti-trust case.
Our two largest detractors during the quarter were Nabors Industries (NBR) and Gray Television (GTN), whose share prices were down 17% and 16% respectively during the quarter. We think both company’s share prices are at deep discounts to their long-term fundamental value; we have recently increased both holdings.
With the recent pullback in commodity prices and increased industry consolidation there has been growing fear that Nabors will experience greater operational pressure on their North America rig business. However, Nabors’ significant global presence has developed long standing relationships with leading energy companies and national Oil companies. While the recent industry consolidation may lead to some near-term choppiness in industry capital expenditures, Nabors is likely to be a long-term beneficiary with the potential for incremental market share overtime. We believe the North America rig market should bottom over the coming quarter and there is potential for incremental rig deployments over the coming 6 to 12 months. Meanwhile, international rig demand remains very robust. Nabors has signed contracts for a 25% increase in their international working rig fleet over the coming 2 years. In addition, their joint venture (“JV”) with Saudi Aramco should continue to scale over the next couple of years with 4-5 new rigs added each year. The JV free cash flow should also have a meaningful improvement as it transitions from cash use to positive free cash flow generation. Finally, Nabors Drilling Solutions division has a growing global expansion opportunity. The segment has very low capital intensity, further growth should also support company future free cash flow generation. With the recent share price weakness, Nabors looks extremely attractive, at less than 1x forward cash flow (only lower post Covid 2020 outbreak), >50% normalized free cash flow yield and forward EV/EBITDA approaching 3x. We believe long-term upside potential for Nabors is multiples of the current share price.
Gray Television remained under pressure during Q2, with ongoing marketplace concerns on the company debt leverage. Gray has limited maturities over the next 2 years and recently announced an opportunistic debt repurchase program. After a slow start to political advertising due to weaker than expected primaries, we expect to see a nice ramp in political advertising in the back half of the year. Gray’s strong local TV stations, #1 and/or #2 in 89% of their markets, has the company well positioned to achieve $500-700M in high margin political advertising in 2024. In addition, Gray has been outpacing peers in growing their core business over the past couple of years and still appear to be in the early innings of an improvement cycle. Management has recently retrained their salesforce with a greater focus on expanding their high margin digital market share over the next couple of years. In addition, ATSC 3.0 (industry new IP standard), provides opportunity for Gray to stream more content and capture new high margin digital revenue streams overtime. We see the potential for $2.5B of free cash flow generation over the next 5 years that could allow the company to rapidly de-lever their balance sheet and accrue value to the equity holder. With a greater than 80% earnings and free cash flow yield, and an attractive 6.2% dividend yield, we believe patient investors have potential to be rewarded over the coming years.
During the quarter, we initiated a position in United Natural Food Holdings (UNFI). The nearly 50-year-old company appears to be a significantly mispriced leading national food distribution company. UNFI share price is down nearly 80% from its former high, as the company experienced recent margin pressure from rising inflation and operating inefficiencies. New management has recently joined the company, including Matteo Tarditi, who came from GE where he helped spearhead the company’s successful transformation. UNFI’s transformation plan over the next couple of years will focus on maximizing their market leading position in natural and specialty foods along with supporting the growth of independent retail chains. The company announced it will be rolling out six sigma/lean initiatives to help drive operating efficiencies in their national distribution footprint, which supports >$30B of annual revenue from 30,000 customers in all 50 states and 10 Canadian providences. UNFI is also expanding higher margin services to their customers which have long-term grow potential and should further support the company’s profitability improvement initiatives. As cost efficiencies continue to be realized over the coming years, United Natural Foods has the potential for margins to improve from historical trough levels towards industry peers. With a multi-year transformation there is always risk of short-term disruption to operations as management undertakes new initiatives to improve the company’s long-term profitability. However, we believe UNFI’s extensive distribution network provides a significant margin safety. UNFI own’s 13M square feet of distribution center and warehouses which is a significant “hidden” asset.
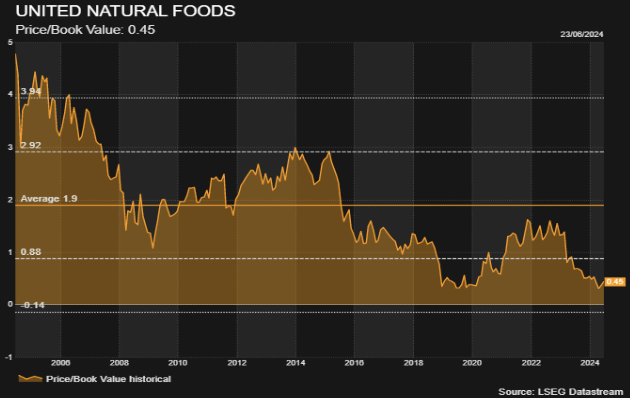
We believe UNFI long-term upside potential is multiples of the current share price as the company business has long-term earnings power greater than $5/share. At time of purchase, UNFI had a market cap near $600M, a >50% normalized free cash flow and earnings yield and 60% discount to book value.
While the marketplace continues to crowd into mega-cap and longer duration equities, we believe Miller Deep Value Select provides investors with a timely strategy. At quarter end, the portfolio weighted average market cap is less than $1.3B. While the market capitalization of our holdings is very low, they have a sizable asset base, providing a margin of safety, and business model with the potential to generate significantly higher earnings and free cash flow over the next couple of years.
Miller Deep Value Select has also historically benefitted from identifying significantly mispriced and underfollowed securities. Since the strategy’s inception, nearly 1/6 of historical holdings have been acquired in corporate mergers or acquisitions at share prices that were more than 250% above our initial purchase price. As industry sources have recently highlighted more than half of M&A activity today is taking place in companies under $1B market cap. If this trend continues there is a potential that additional holdings may be acquired over the coming years. We remain very excited about the strategy as new investments over the past year have enhanced the overall portfolio in our assessment. Our combined portfolio holdings today are near 2x cash flow, have a price to sales less than .2x and normalized earnings and free cash flow greater than 30%. The long-term embedded return potential today is not far from Covid 2020 extremes!
We thank our clients for their long-term partnership and remain disciplined to our investment approach to generate attractive long-term returns.
Dan Lysik, CFA
July 2, 2024